This study considers 20 years of rare earth international trade from 1996 to 2015. We analyzed the evolution of these networks in four aspects, which include the distribution of the trading countries, the overall structure of the network, the key countries in the network and the communities in the network.
The distribution of the trading countries for rare earths
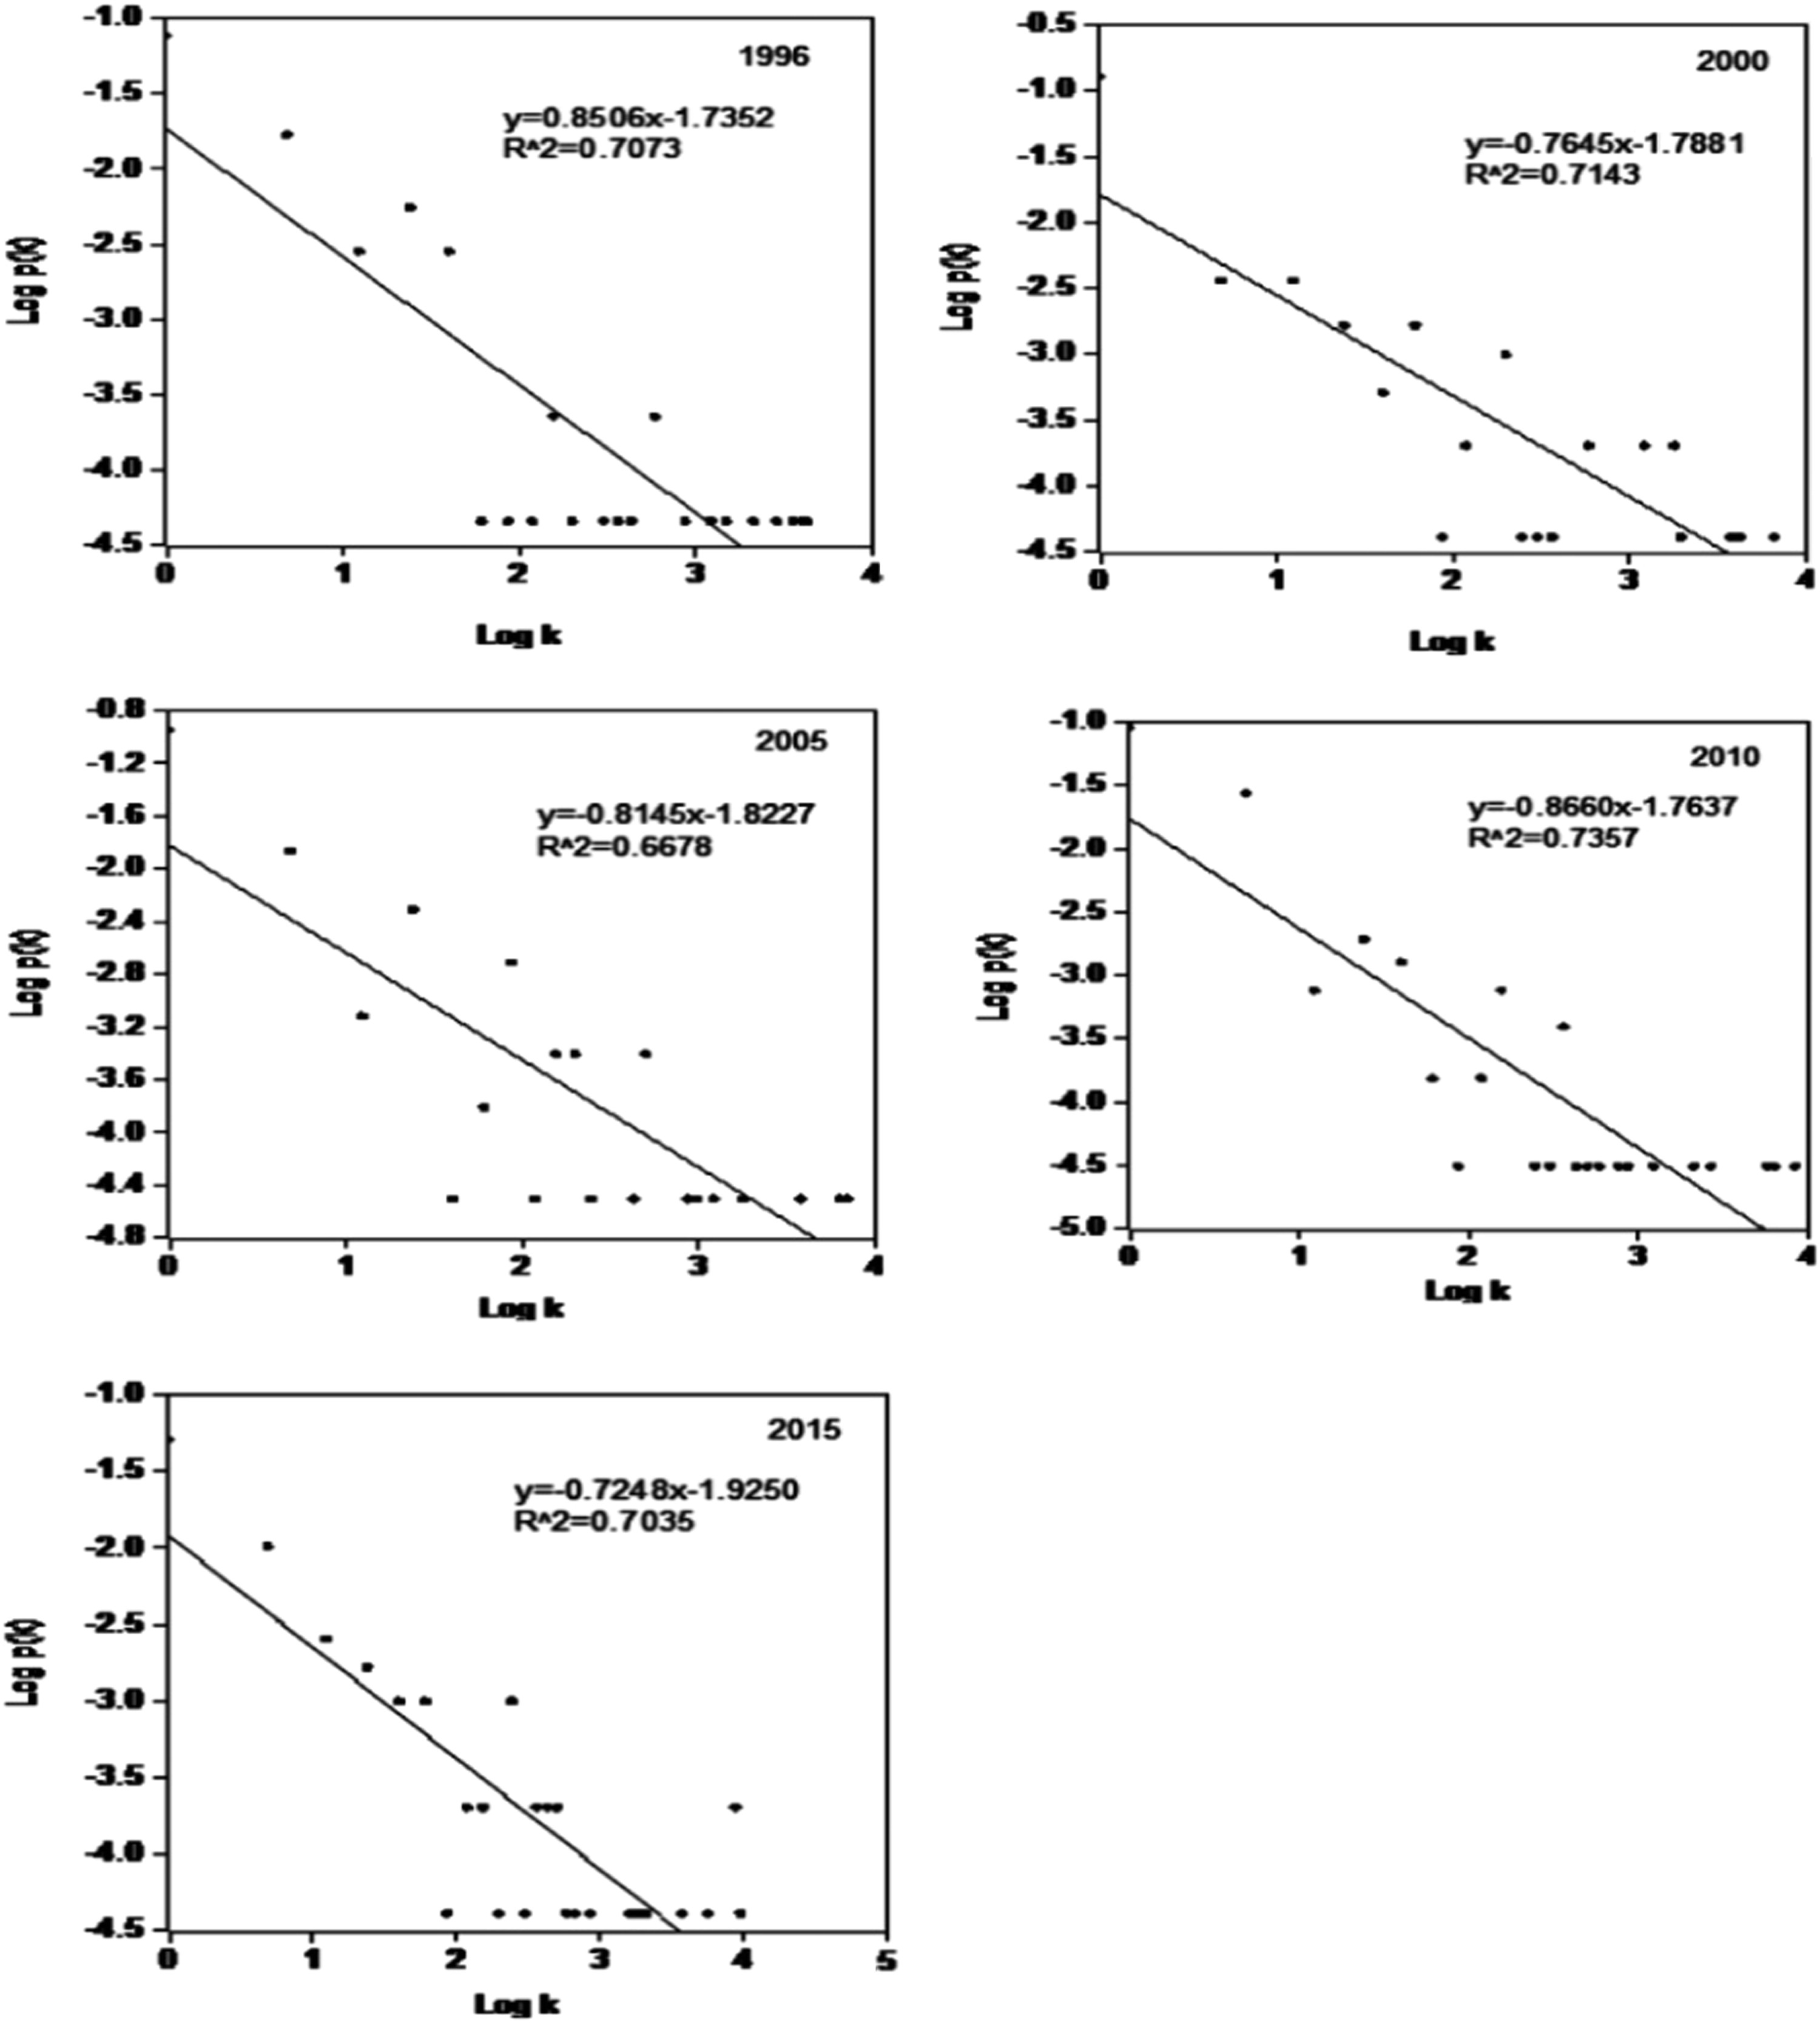
To analyze the distribution of countries, we have taken the degree distribution and the estimate of kernel density. The study calculated the fit function of the degree distributions in log-log coordinates from 1996 to 2015 (table 1). The market value is about 0,7. It therefore indicates that the rare earth trade network is a stable, scale-free network over time. This value clearly shows a power-law distribution, which is the typical feature for scaling-free networks (Fig. 1). Scaled-free networks usually have a preferred binding mechanism, which means that new countries prefer to build trade relations with priority countries in the Rare Earth Network.
Fig. 1. Program distribution in the log-log coordinate in the years 1996, 2000, 2005, 2010 and 2015.
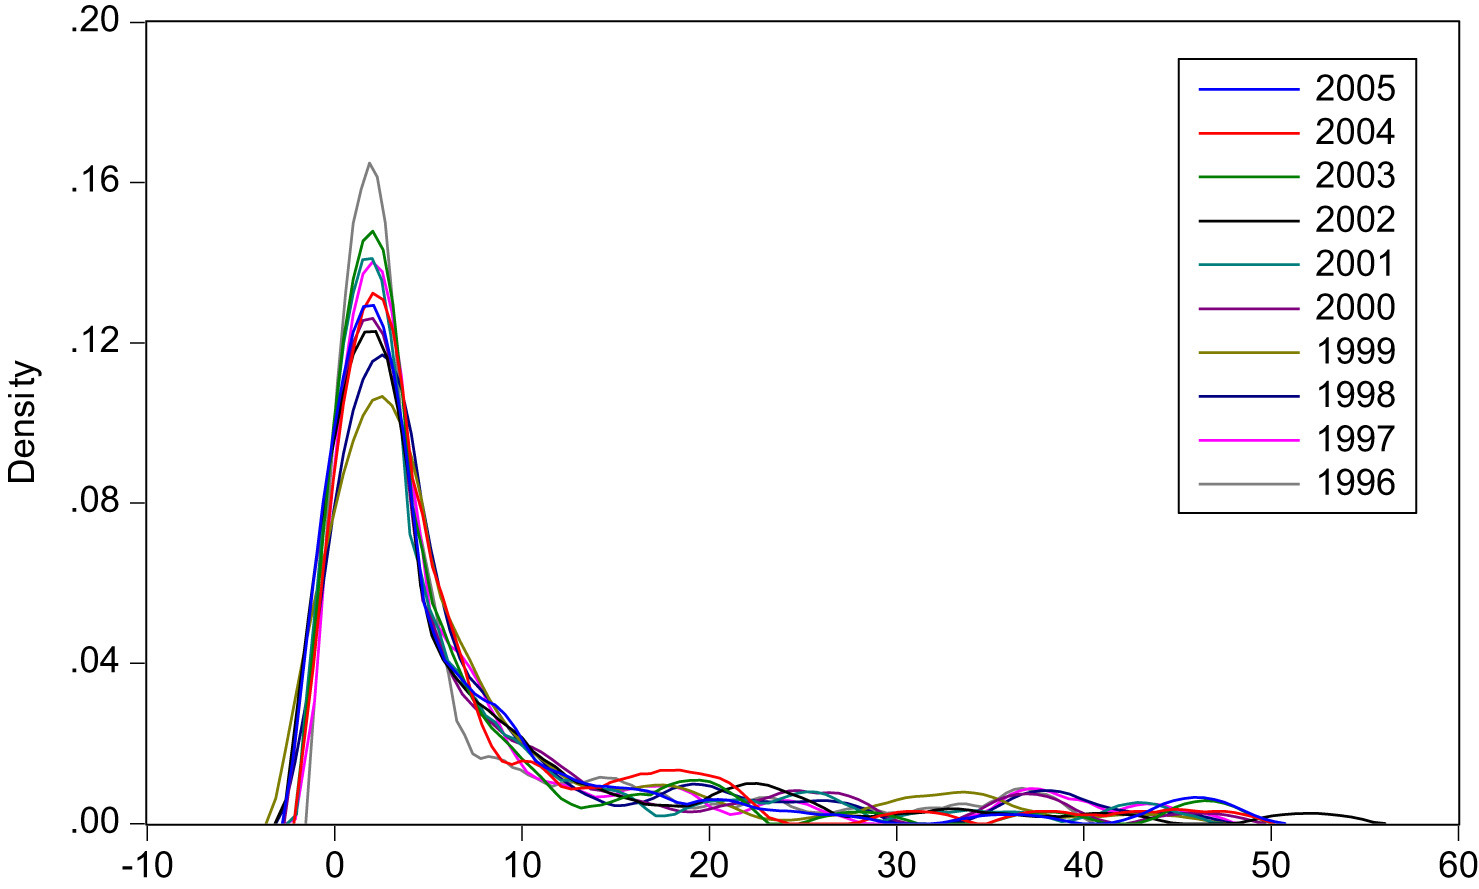
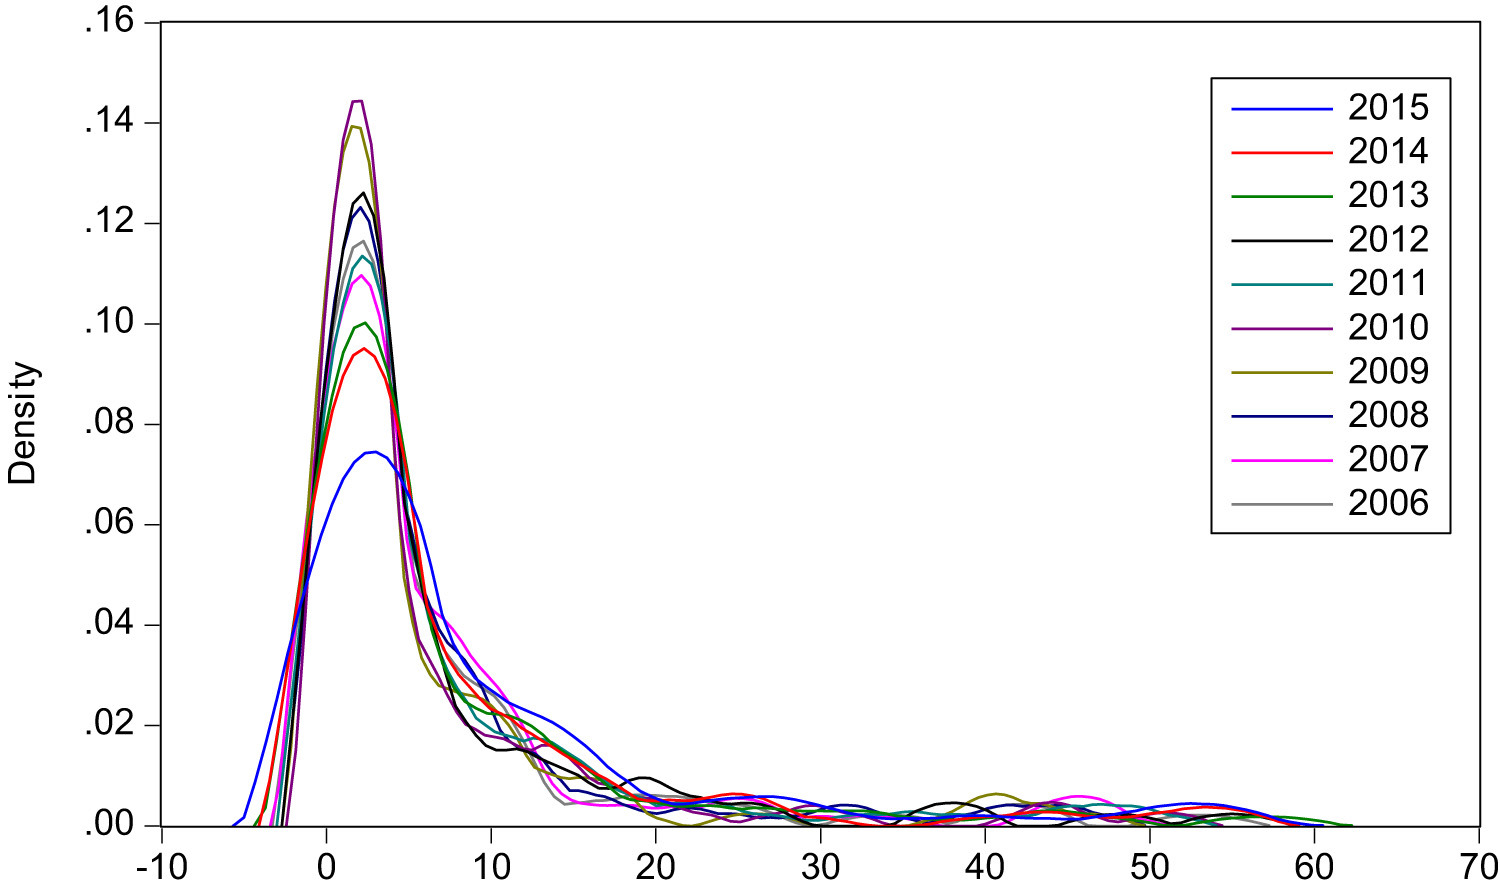
To get an insight into the spatial distribution of countries with different emphases, we calculated the estimates of the core density from 1996 to 2015 (Parzen, 1962b). In Fig. 2, Fig. 3, the abscissa indicates the degree and the ordinate indicates the kernel density. In summary, the core density curve of the grade is clearly dextrorotatory, suggesting that most countries have some trading partners, while only a few countries have a larger number of trading partners. Most trading participants favor a stable trade relationship with a handful of countries, reflecting the uneven distribution of rare earth resources that are concentrated in a few countries. The top point of the curve corresponding to the level is about 3, which means that most countries have 3 trading partners. This analysis confirmed that the rare earth trade network has the characteristics of a small group. When detecting the peak point of each curve, it is clear that the value of each peak point decreases with time. The value of the peak point is 1996 at about 0,16, and 2006 dropped to 0,12; 2015 is the peak then only 0,07. As a result, most countries' trading partners have increased in recent years, indicating that importing countries have built up more trade relations with a larger number of countries.
Fig. 2. The core density of the degree of international rare earth trade from 1996 to 2005.
Fig. 3. The kernel density of the degree of international rare earth trade from 2006 to 2015.
Analysis of the entire network structure
Having confirmed that the international Rare Earth Trade Network is a scale-free network, there are several network structure features that require further analysis, namely, nodes, edges, network diameter, network density, average path length, and clustering. Coefficient.
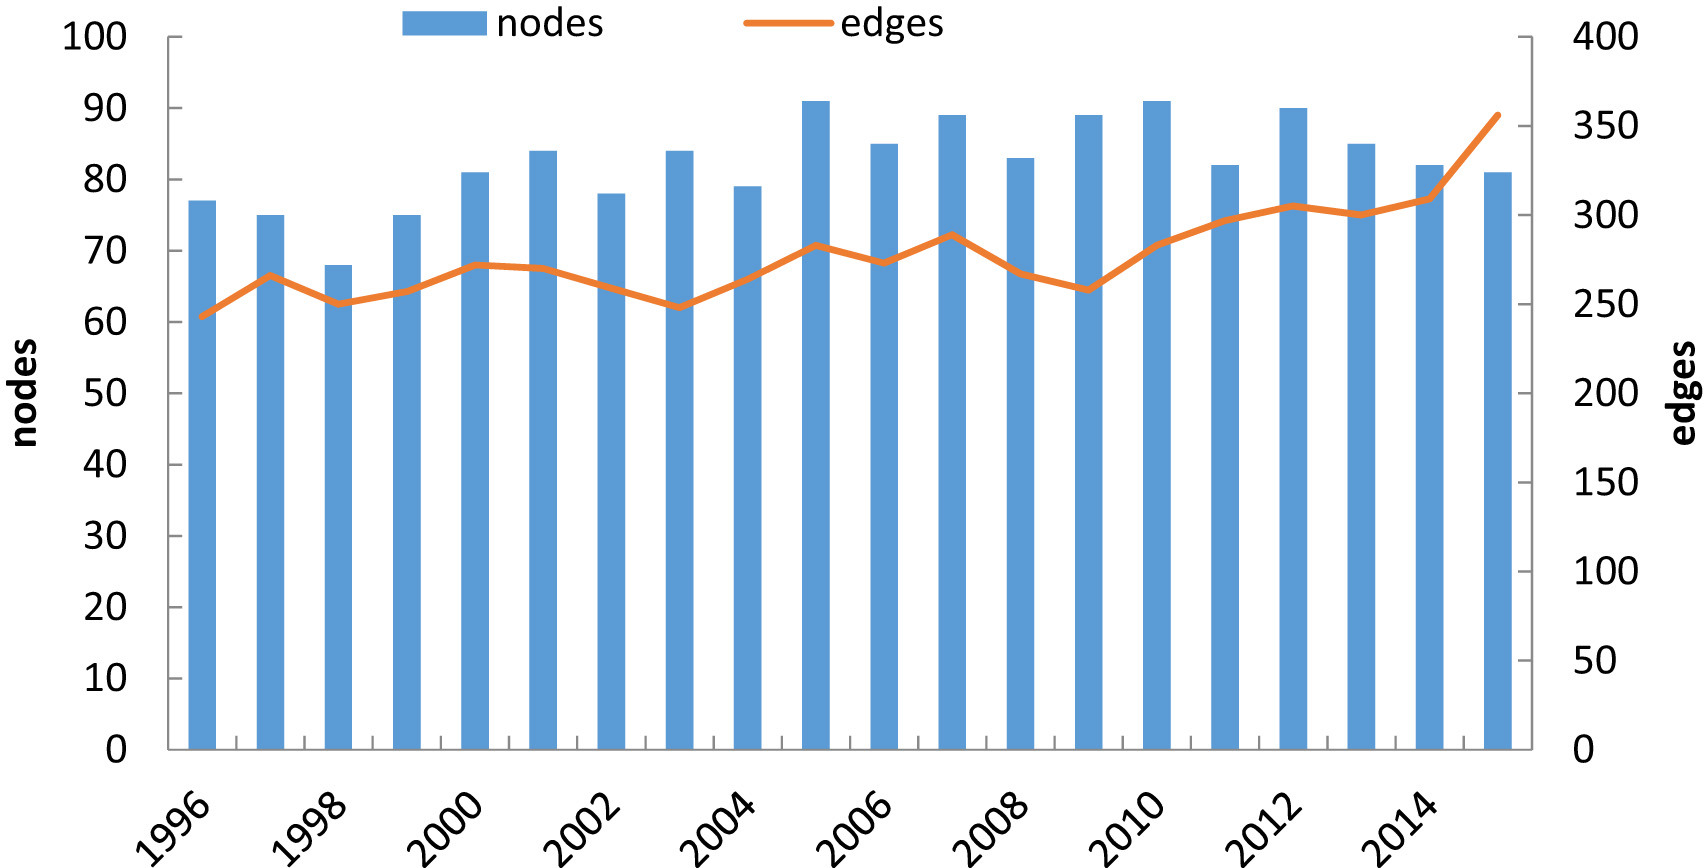
In Fig. 4, the nodes represent the number of countries and the edges the trade relations. In the last twenty years, the international rare earth network has not changed significantly. The number of trading countries remained 80-90, which would have been possible for two reasons. First, while rare earth ore is geographically diverse, rare earth production is a complex and expensive process. The current possibilities for processing rare earth metals into finished materials are mainly limited to Chinese sources. Thus, the country of production can not be changed in a short time; second, roles have changed over the years for some countries, such as Russia and Australia. Russia has not produced any rare earth on a commercial scale in recent years, while Australia 2012 commissioned a new rare earth mine on Mount Weld. But both countries continue to trade in rare earths. Therefore, the primary participants will not change in the short term. The graph shows that the number of edges in the rare earth trading network in the years 1996-2009 fluctuated around the 250. However, it is clear that this has increased since 2010. On the one hand, rare earth metals and their compounds are important raw materials for high technology products, which are widely used in the military, clean energy and electronic information industries. With the rapid development of business and technology, demand for rare earth materials has increased in most trading countries. On the other hand, as global economic integration becomes more and more apparent, the trading countries expand their trade relations to create more partners. On the other hand, as global economic integration becomes more and more apparent, the trading countries expand their trade relations to create more partners. (Table 2)
Fig. 4. The trading country and trade relations of the international rare earth trading network.
Network diameter
Network density
Avg. clustering coefficient
Avg. path length
1996
5
0.042
0.262
2.329
1997
5
0.048
0.299
2.309
1998
5
0.055
0.394
2.425
1999
6
0.046
0.215
2.516
2000
6
0.042
0.241
2.502
2001
6
0.039
0.257
2.456
2002
5
0.043
0.33
2.459
2003
6
0036
0.289
2.441
2004
6
0.043
0.316
2.636
2005
6
0.035
0.238
2.661
2006
6
0.038
0.262
2.614
2007
6
0.037
0.24
2.652
2008
5
0.039
0.314
2.429
2009
5
0.033
0.247
2.546
2010
6
0.035
0.291
2.548
2011
6
0.045
0.309
2.68
2012
6
0.038
0.274
2.674
2013
6
0.042
0.282
2.695
2014
5
0.047
0.356
2.467
2015
5
0.055
0.361
2.569
Table 2. Diameter, density, average clustering coefficient and average path length of the international rare earth trading network.
From the results we can draw certain conclusions.
1.
The average path length is about 3, which means that for every pair of countries that import or export goods to other countries, the average number of steps is 2, that is, every other country can have a rare earth trading relationship if two other countries are (on average) mediators between them. The mediators act as “bridges” in the trade network, which means that the rare earths from abroad are usually first transferred to these countries and then distributed to other countries. The diameter of the network is 5-6.
2.
The average clustering coefficient is around 0,3 and is on an upward trend, suggesting that relationships between trading countries are getting closer and closer. Since the clustering coefficient is defined as the ratio of the ratio averaged over all nodes, e.g. N is the number of edges between the trading partners of a country, and M is the maximum number of edges that could exist between the partners of the country. The larger number of clustering coefficients thus indicates a closer connection between the trading countries. In general, when a network can be highly clustered and has a low average path length, we call it "small-world" networks. As a result, rare earths trading is a small world network.
3.
The value of density represents the tightness of a network, the greater the value, the closer the relationships between all countries will be. The density of the rare earth trading network is relatively low, with an upward trend in the 1996-2015 years, which means that trade relations between countries are relatively loose, but trade relations in the network have increased in the last 20 years.
The identification of the main countries of the network
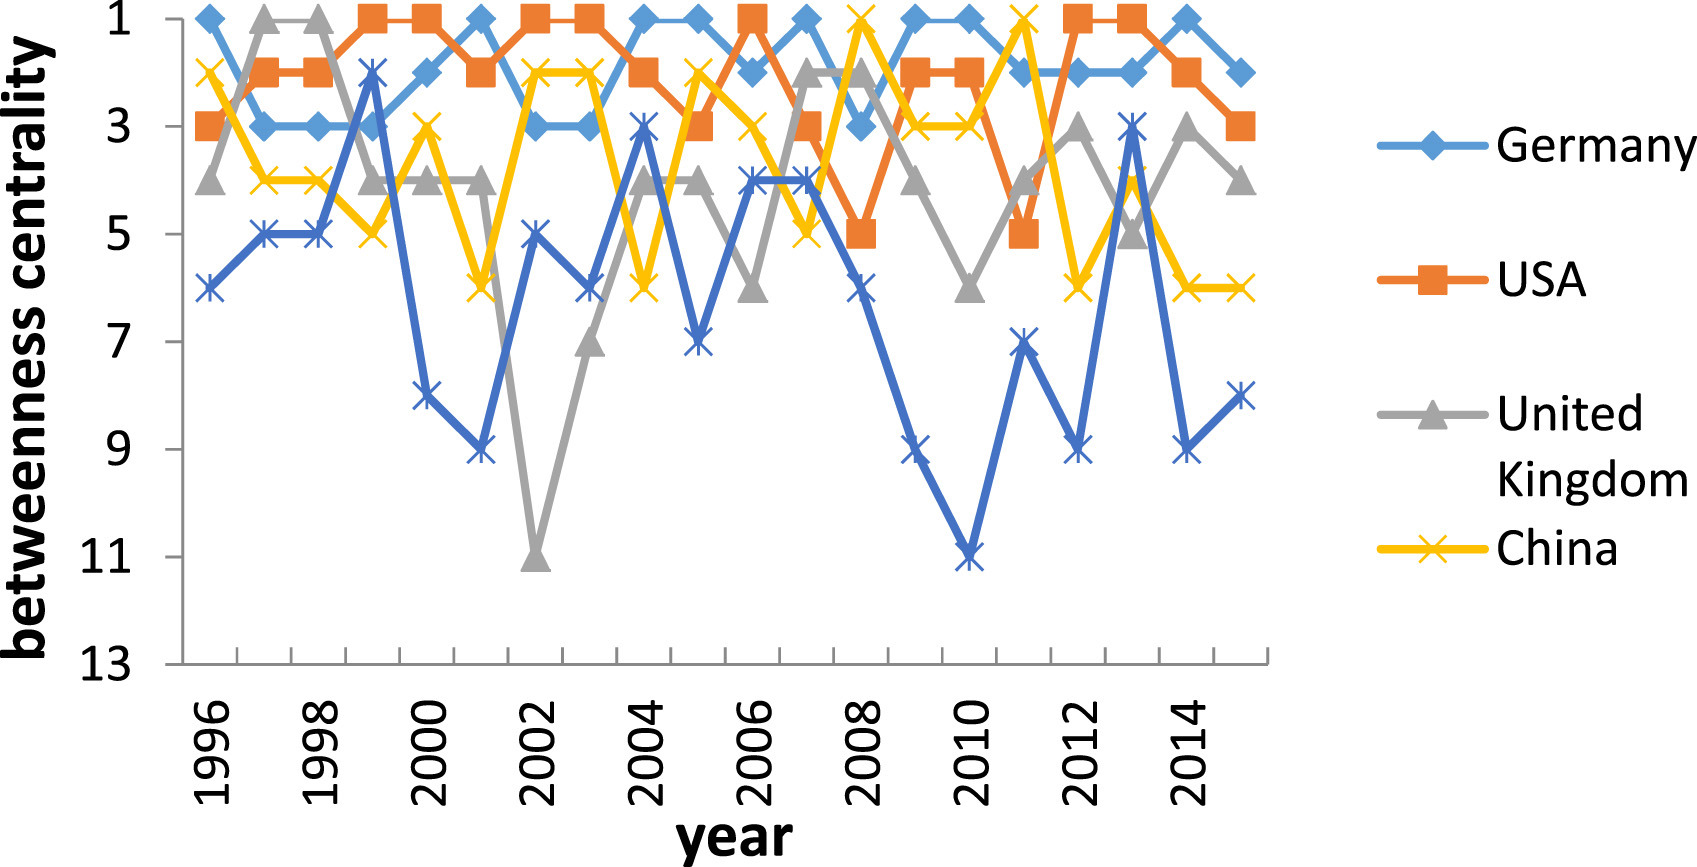
After looking at the overall structure of the network, we analyzed the main countries in two ways. We have chosen inter-centrality to identify the retailers of rare earths (Fig. 5). The United States is the main mediation country, which means that many countries trade in rare earth with the United States, and that means they act as mediators. Therefore, the United States has become the centerpiece of the global rare earth trade network. The inter-centrality of Germany fluctuates, while the rank of China, Great Britain and France decreases.
In addition, we chose to identify the major exporting and importing countries for the weighted In-Gree and Out-Grade method. Each country of trade plays a different role in international rare earth trade because of its resources, industrial development and political background. The larger the weighted degree of a country, the more it has an influence on the trading network.
Fig. 5. The development of the ranking of the centrality of the main countries that we have studied 1996-2015.
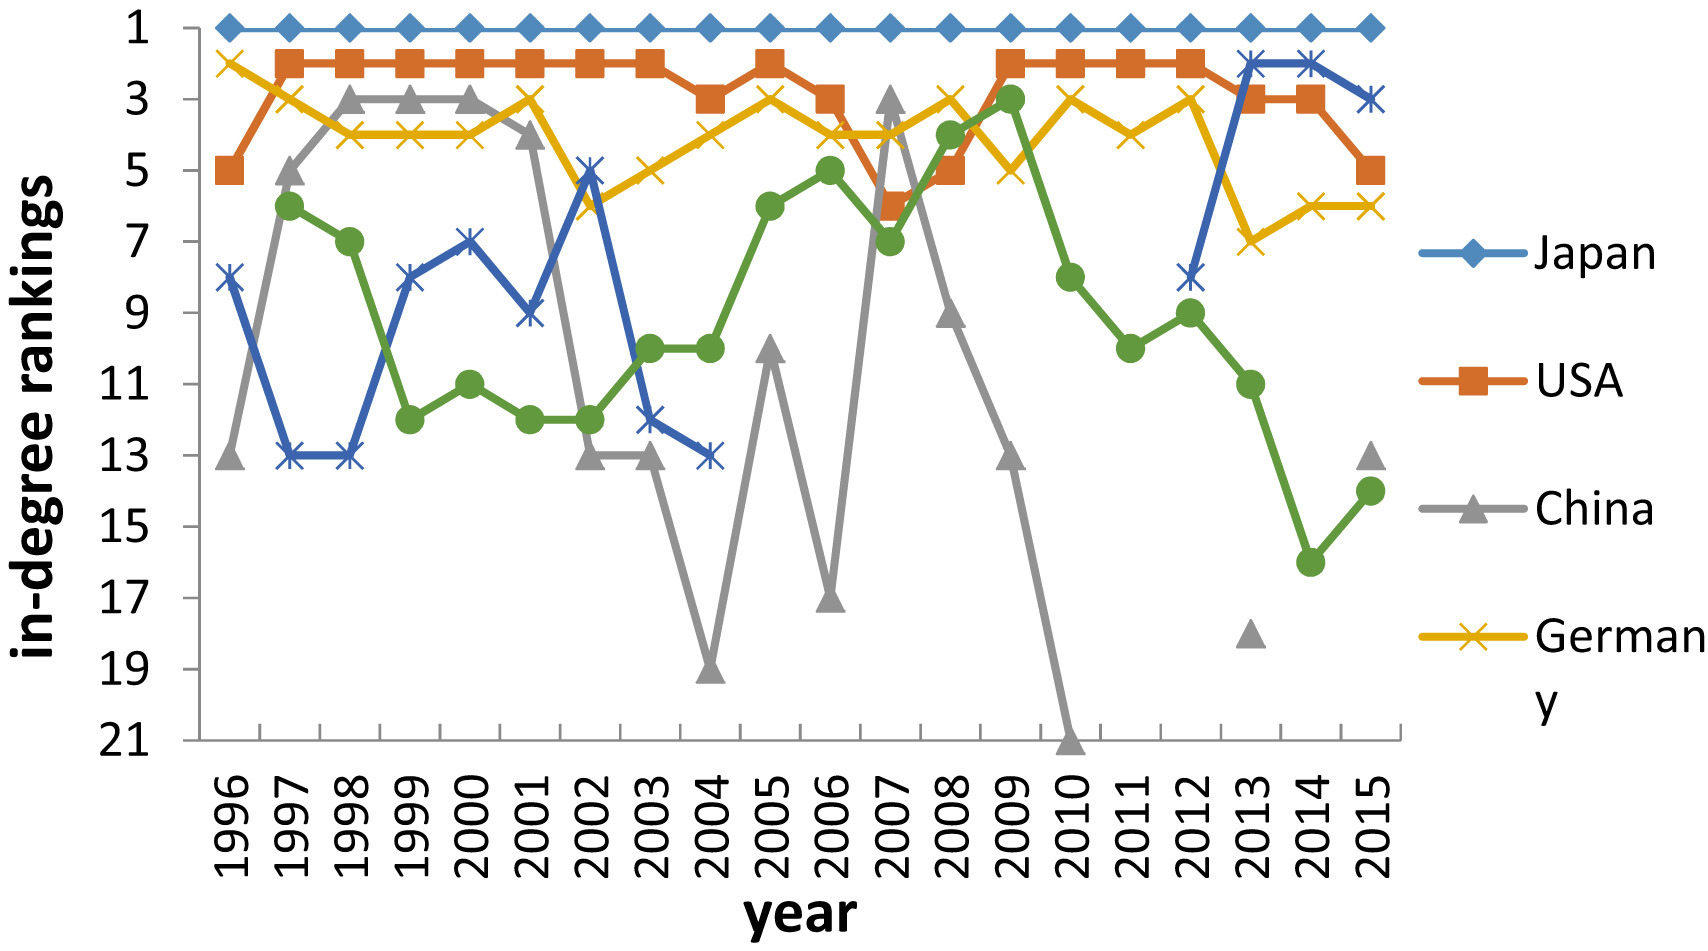
Following the rank of the weighted In-Gree network among all major importing countries, Japan plays an important role in the international import business and is one of the largest rare earth consumers in the world. Because rare earths have a wide range of applications in the automotive, aviation, military and electronics industries as well as in other industries. Japan's rare earth industry has the core technology and craftsmanship, with cheap, convenient supply of rare earth, with developed high-tech industry. However, Japan is a resource-poor country. More than 90% of the rare earth materials needed to manufacture hybrid cars or household appliances rely on imports from China. The United States is the second largest importer of rare earths and has abundant resources of rare earth resources. The rare earth primary resources include bastnaesite and monazite. Unlike China, which has many rare earth resources, the primary products of the United States depend on imports. Moreover, in recent years, partly because of lower labor costs in China, coupled with environmental concerns, the United States has become a net importer protecting its own rare earth resources. China is the largest rare earth producer and exporter in the world, covering more than 80% of the world's total demand. Illustration However, 6 shows that China's weighted in-Gree ahead of 2002 is among the top 5, suggesting that Chinese rare earth imports continue to be active during this period. In recent years, most of the rare earth products in China have been of poor quality due to the inadequate structure of the rare earth industry and the poor technology. Most high technology products rely on imports from developed countries. Little by little, China has developed a trade pattern that exports cheap raw materials and imports expensive end products. Currently, China has made great strides in developing high-efficiency cleaning and high purity rare earth separation technologies with the development of technologies and adaptations in the industrial supply chain. Malaysia has the world's second largest rare earth processing factory, which 2013 has started producing rare earths. Because Malaysia is a resource-poor country, almost all rare earth resources are supplied by Australia. Similar to Malaysia, there is a world-famous rare earth separation and processing company in France, Rhodia, which uses advanced processing and production technologies; however, all the required raw materials of rare earths must be imported. Among the resource-poor countries, Germany is a major consumer of rare earths.
Fig. 6. The development of the in-Gree rankings of the top 6 countries.
By analyzing the six main countries, we can easily see that the majority of the trading countries are resource-poor countries, with the exception of China and the United States, which shows how active low-resource countries are in building import relationships and the importance of rare earths.
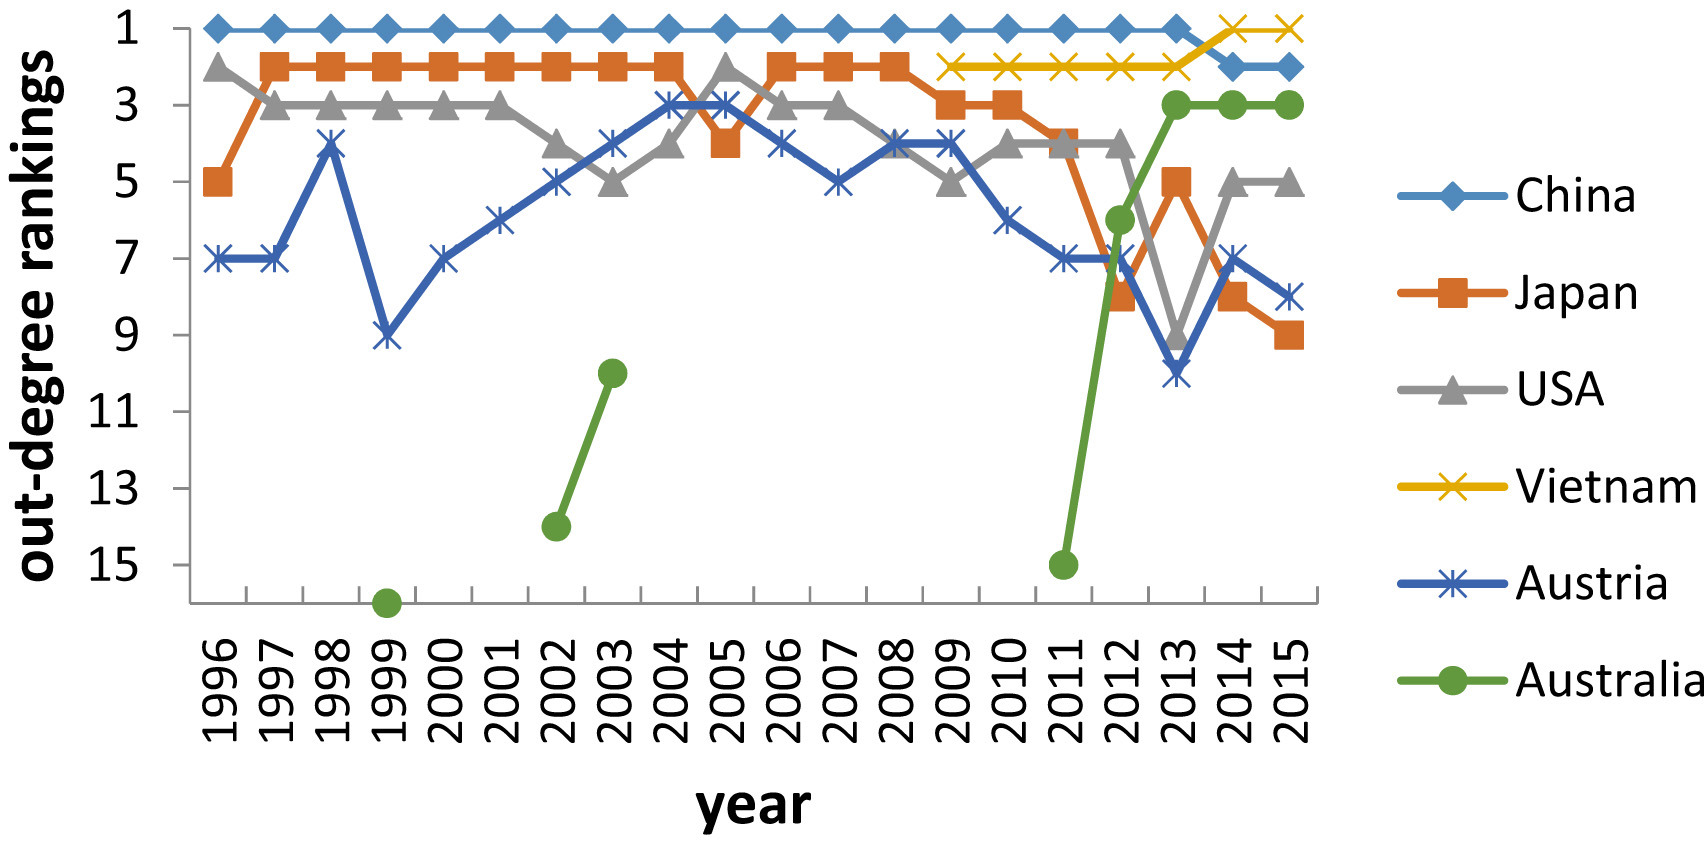
According to the results in Fig. 7, we note that China ranked first among 1996 and 2013 and held a dominant position in the international rare earth market. As the largest rare earth producer, China has supplied more than 80% of the world's rare earths in recent years.
Fig. 7. The development of the out-grade rankings of the top 6 countries.
Japan has a large number of rare earths imported from China and Vietnam, and its export business was one of the top 2011s before 3. According to the Japanese export data, the main export directions are the United States, China and France. Although Japan is a resource-poor country, its technology is superior to separation and extraction in rare earths of other countries. By importing cheap rare earth raw materials from China, processing and cleaning the materials, then exporting intermediate or finished products to other countries after meeting their own needs.
In the past, Vietnam, a rare earth country, had virtually no rare earth trade, but since 2009 it has become a focal point for trade. The ranking index for Vietnam saw 2009 soar, outperforming Japan to become 2013's second most important country of origin. According to trade data, the main export directions are Japan and the United Kingdom. From 2010, Vietnam and Japan have been cooperating in the development and production of Rare Earths because China has halted supplies of rare earths to Japan after an incident involving a fishing trawler. For Vietnam, the amount of rare earths exported to Japan accounts for more than 99% of total exports. As a result, the total export value of rare earths in Vietnam from 2013 exceeded that of China. Vietnam's weighted out-grade ranked first in the network, making Vietnam another important rare earth supplier. In addition, 2012's East Fort Rare Earth Project has been formally developed and phased-in, leading to changes in the international rare earth market.
Australia is known for the richest rare earth deposit in the world, known as The Mount Weld deposit. Kanazawa and Kamitani, (2006). However, the impact of global rare earths prior to 2012 was insignificant. As a result of dealing with Chinese rare earths and other factors, rare earth prices rose again, causing some countries to increase production. In the year 2012, Australia has significantly increased its exports; the main exporting countries are Malaysia, Canada and India. Among these countries, the trade volume exported to Malaysia accounted for more than 95% of total export volume. In addition, Rare earth products focus on light rare earths mainly due to the expansion of the rare earths in Australia and Malaysia. This allows for significant production, but also lowers costs, which has increased its competitive advantage in the trade. In addition, trade patterns used to be that China provided most of the world's rare earth resources, but this has changed. Vietnam's export value has increased dramatically in the past five years. Vietnam became the leader of the rare earth export trade from 2013 and its total value for rare earth trade is 119.413.690 $, which is above China's. As a result of the fishing trawler accident, Vietnam became Japan's new trading partner, working together to develop and produce rare earth resources. In addition, more countries participated in the rare earths production market, which led to China's impact on global rare earth trade decreasing.
Another country among the top six is the US. Unlike China or Japan, the United States has different characteristics with respect to its rare earth trade. Although the export volume for the United States is lower than that of the above mentioned countries, it has established a wide range of trade relations and has many trading partners who can strongly protect the security of their rare earth resources. It therefore plays a crucial role in the international market for rare earths.
The structure of the network
In the international rare earth trade network, trade relations between certain countries are stronger than in other countries, leading to the formation of several small communities. A complex network can be divided into several communities; the connections of the nodes in the communities are denser and the connections of the nodes between the communities are relatively thin. Modularity is one of the most important indicators to measure the quality of the division of communities. The value of modularity is between 0 and 1; a greater value for modularity is a better partitioning of a complex network. If modularity is close to 0, relations between countries in international rare earth trade are narrower and the divisions between communities are vague. If modularity is close to 1, the communities in the network will be obvious and the countries will tend to form small groups so they can work together. In this study, we calculate the value of modularity from 1996 to 2015 as we analyze the evolution of the trading groups.
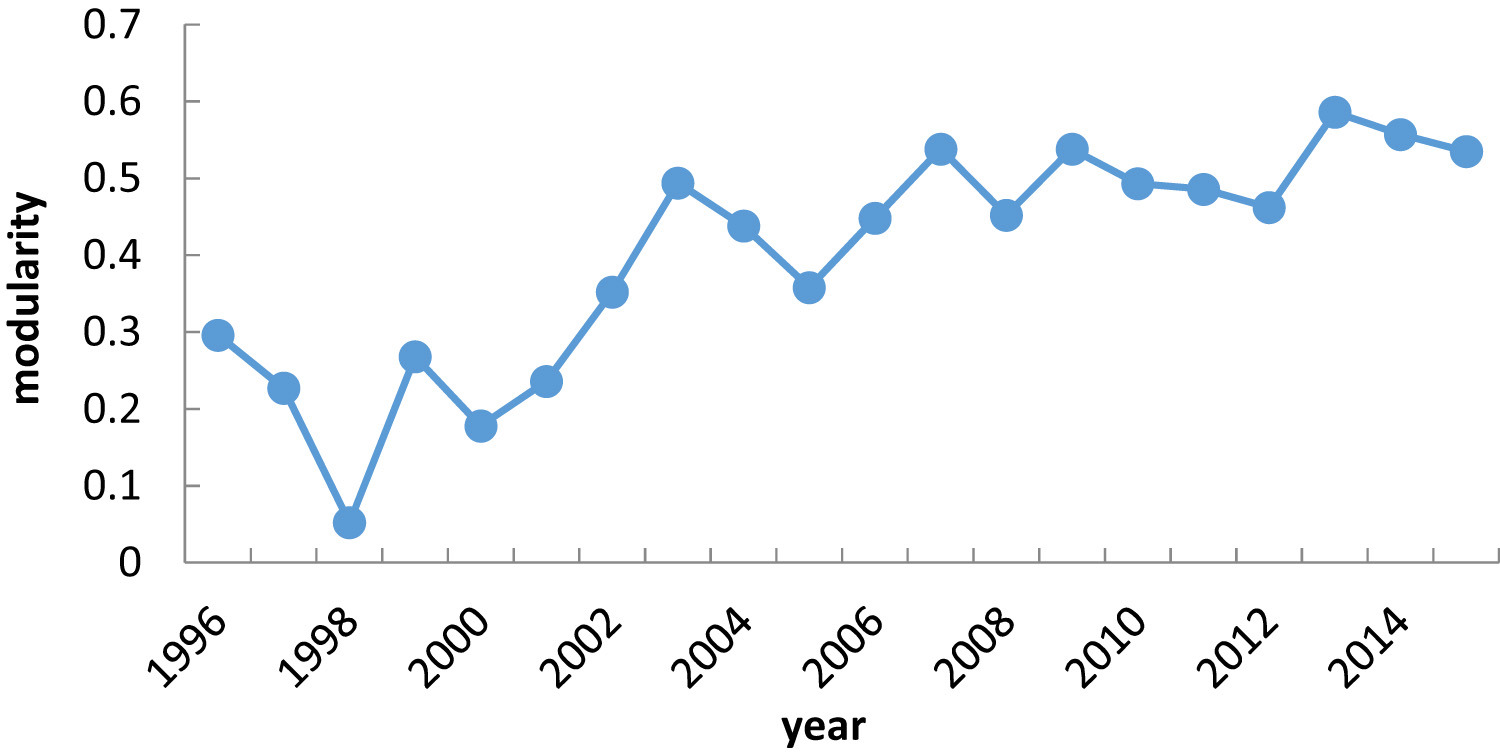
Fig. 8. shows the modularity of the international rare earth network. The modularity curve shows a significant increase from 1996 to 2015. The modularity was 1996 0,296 and 2015 0,535, suggesting that the division of world trade has developed with rare earths of more pronounced and gradually more stable trading groups. Rare earth resources are unevenly distributed, and rare earth primary resources are concentrated in China, the United States, Australia, and other countries, suggesting that global rare earth trade is primarily driven by supply from several large commodity countries depends. As shown in the line chart, the two major variations in modularity occurred in the years 1998 and 2003. In the year 1998 the modularity sank to the low point. This was because China 1998 began to apply its export quota licensing system to rare earth products, and then reduced the tax refund rates for rare earth and rare earth oxides from 17% and 15% to 13% in 2003. All these measures affected the original relationship between supply and demand. Countries without rare earth deposits, such as Japan or Germany, need to look for other trading partners to meet their needs. Germany signed a pact with Kazakhstan to secure access to rare earths and Japan signed a pact for the import of Indian rare earths. Due to rising domestic demand, the Chinese government has gradually reduced its export quota in recent years. In addition, since 2006, the Chinese government has introduced other policies, such as the control and banning of primary rare earth products, and the requirement for qualifications for the management of rare earth exporting companies. In addition, the decommissioning of the world's largest California Mountain Pass rare earth supply source led to short-term fluctuations in the modularity of the trading network.
Fig. 8. The modularity of the international retail network of rare earths.
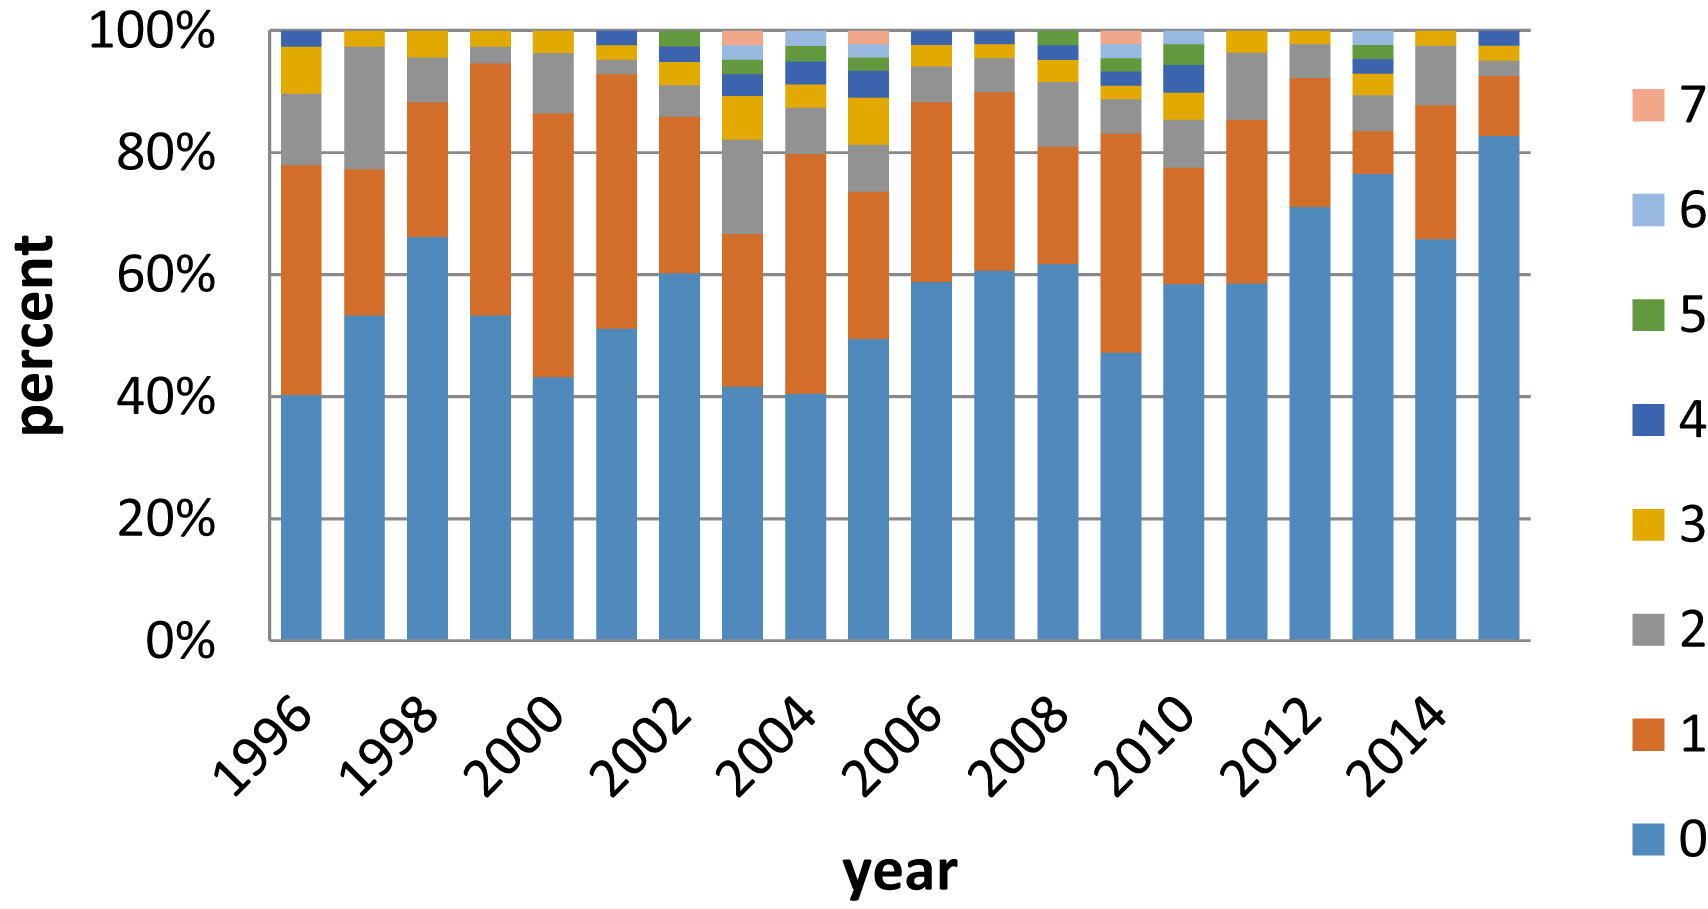
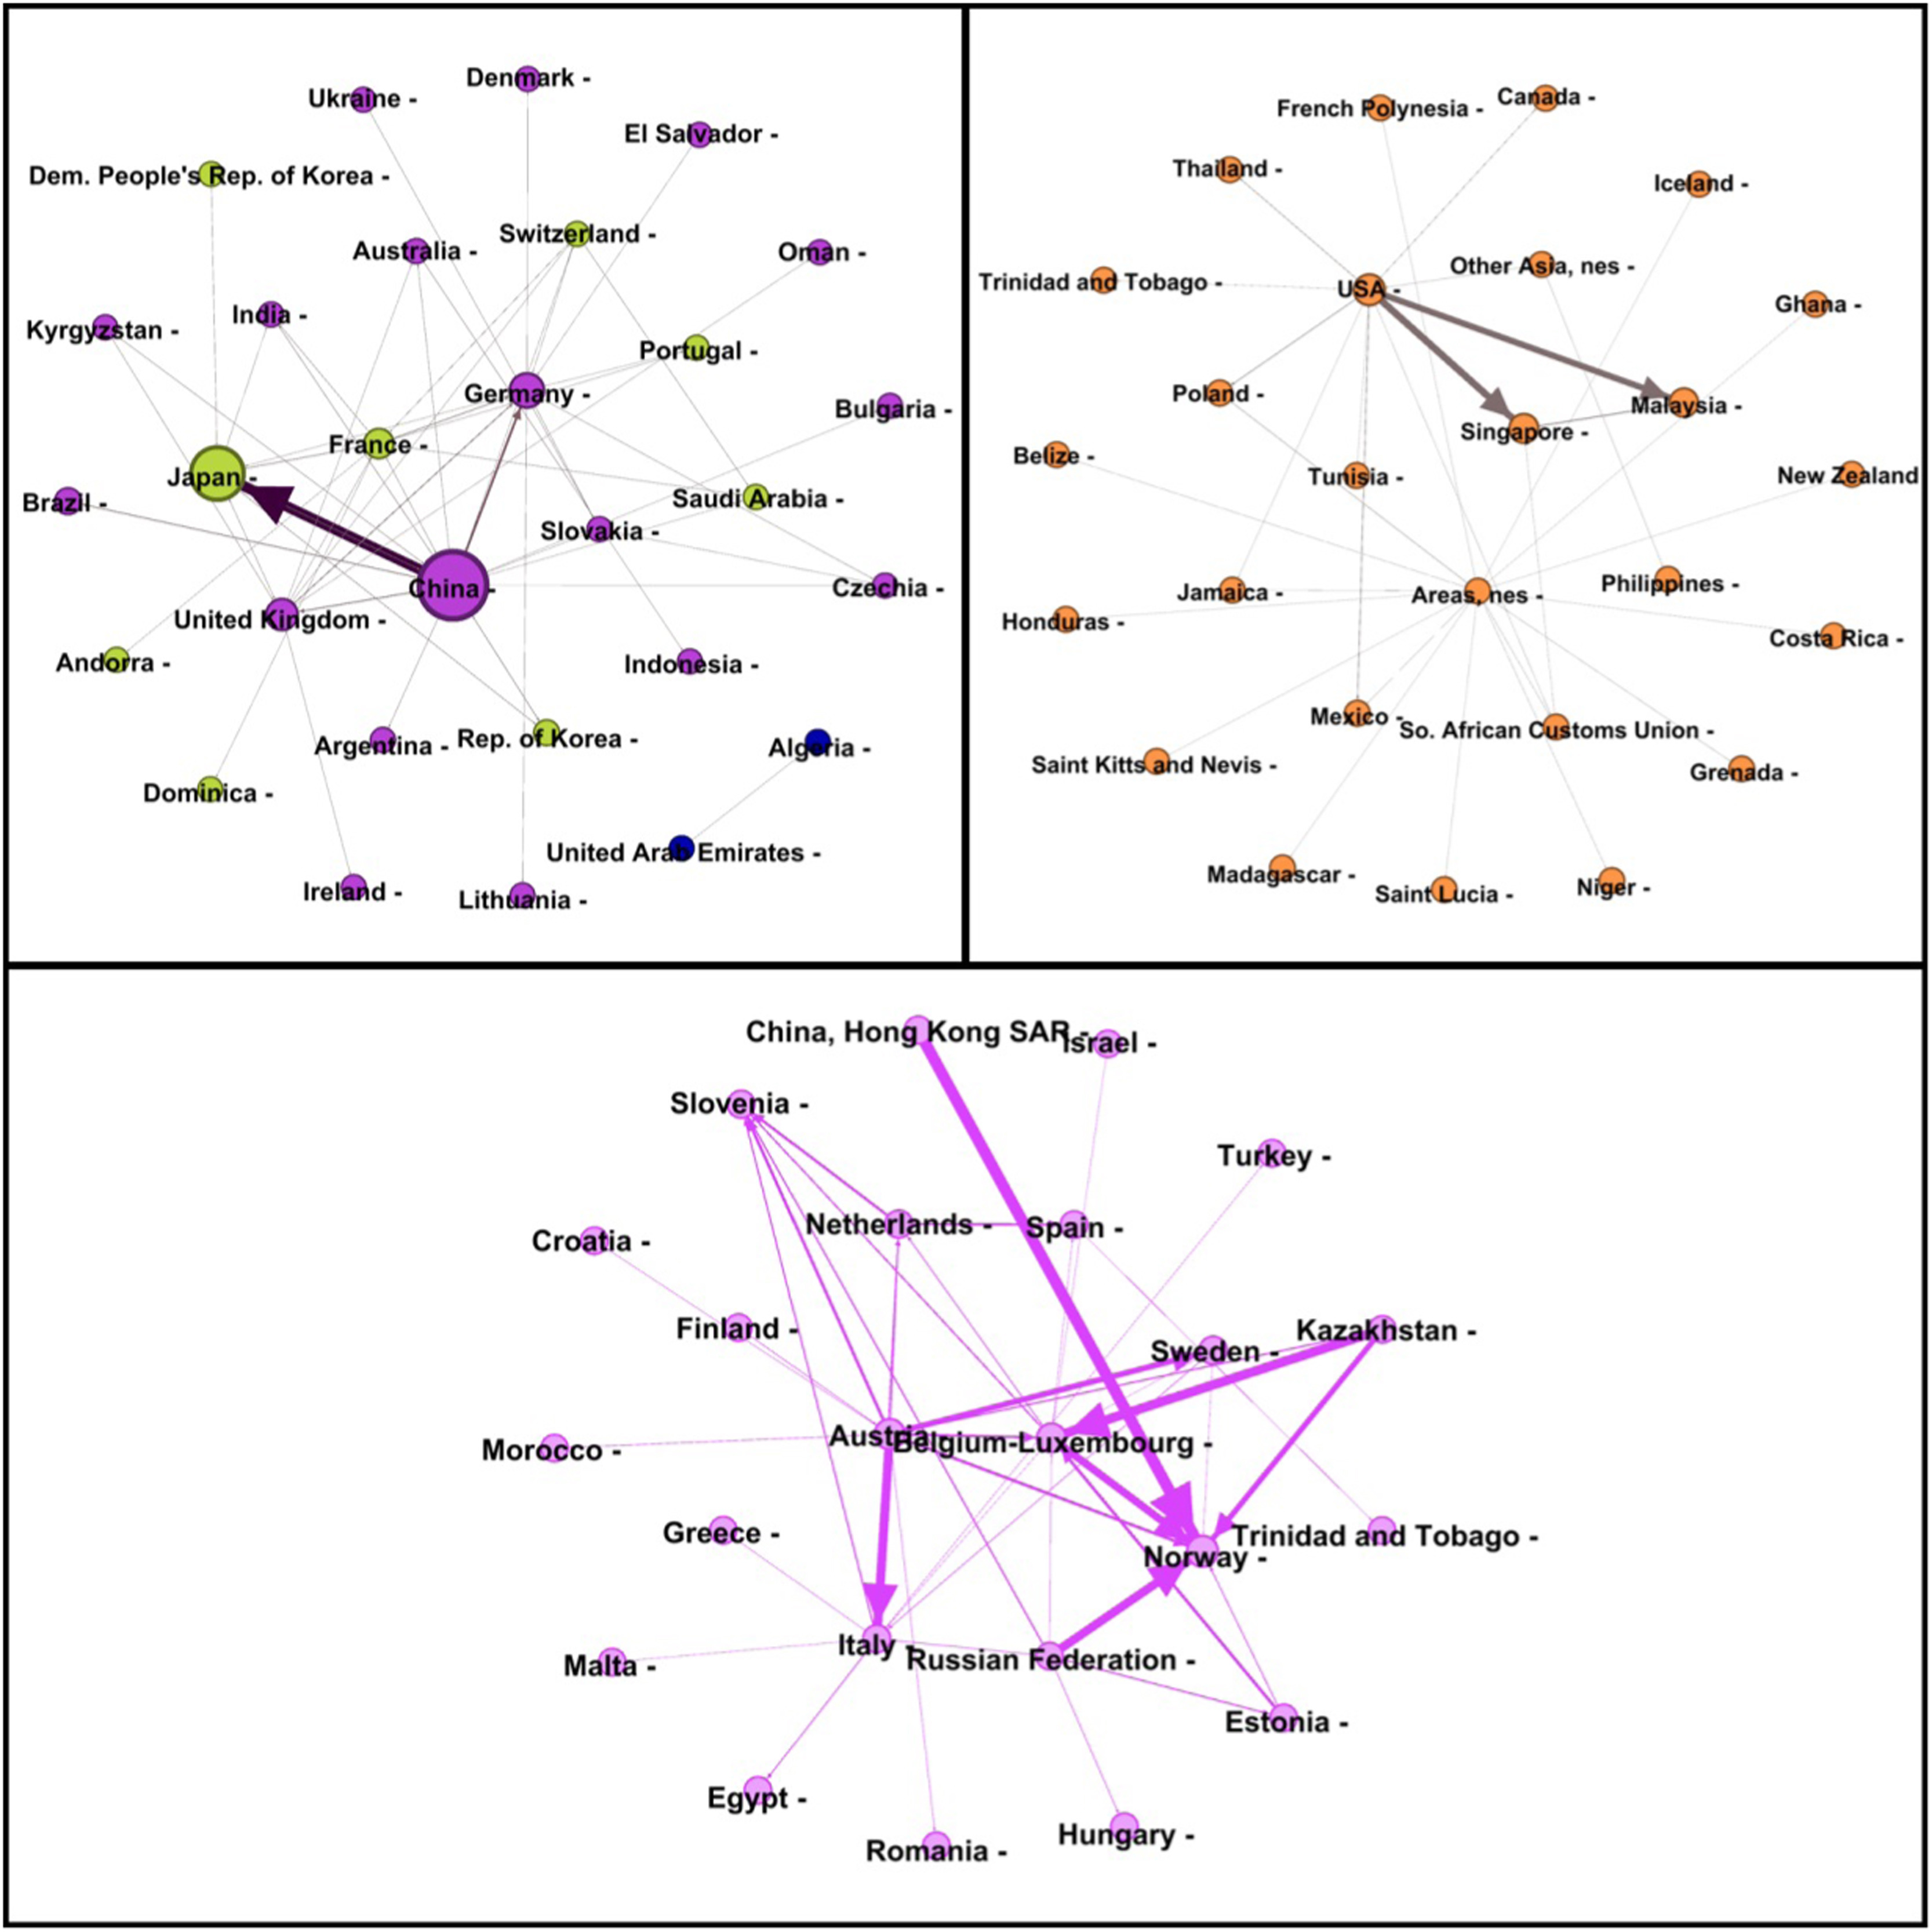
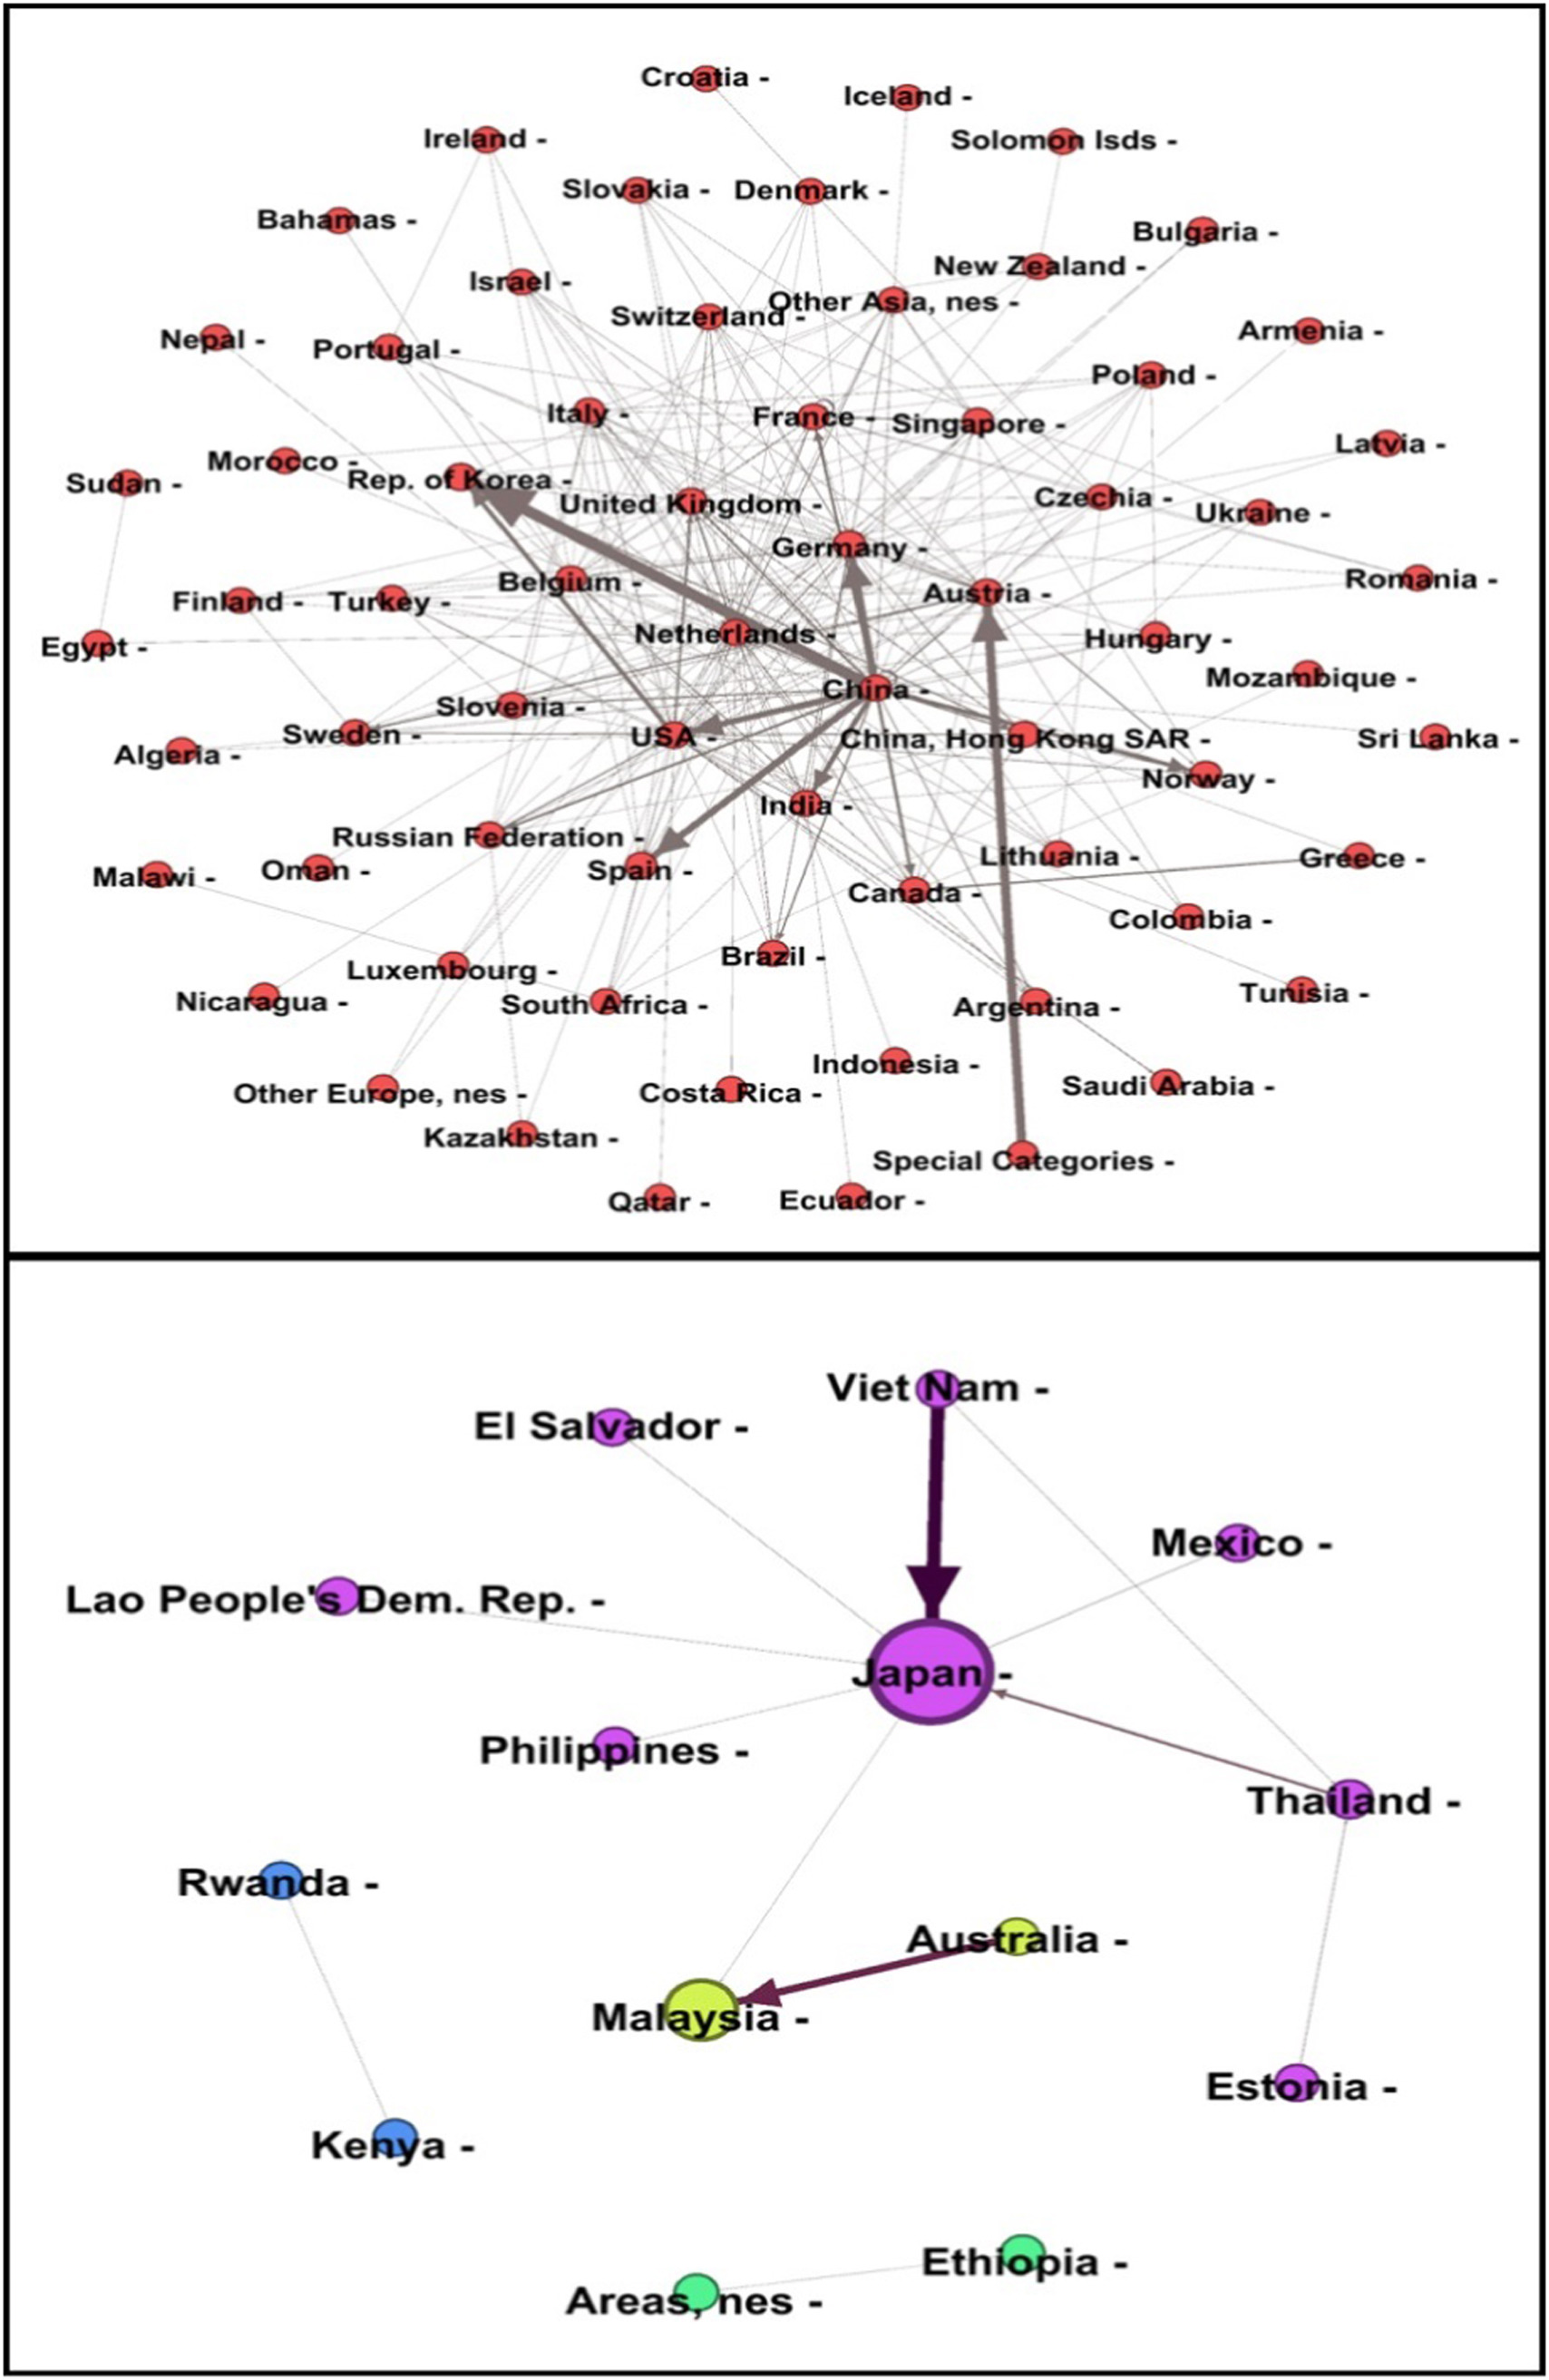
To gain a more intuitive understanding of the common boundaries of rare earth trade, we analyze trends in the trading community trends from 1996 to 2015. Illustration 9 shows the number of locations in international rare earth trade. The main axis represents the percentage of each community in the entire trading network, and each color indicates the members in each community. In Fig. 10, Fig. 11, for each network are nodes of the same color in the same communities. In addition, the size of a node represents the degree of land and the width of the margin represents the total value of rare earth trade for that land. Illustration 10 shows that the worldwide rare earth 1996 trading network was clearly divided into 5 regions, of which 3 are large. The first group includes Norway, Austria, Kazakhstan, Italy, etc. The US, the second largest exporter, is the leader of the second community. Members of this community include Mexico, Singapore, Malaysia, Poland, etc. The third community is represented by China, its members include France, Britain, Germany, India, etc. Japan and France belong to the fourth community. The structure of the communities shows that the majority of countries usually have trade relations with geographically close countries. Illustration 9 shows that the number of communities has gradually declined by the year 2000. China, the United States and Japan merged into one community. Countries such as Australia, rich in rare earth resources but less active in low-value trade, are closely linked and have formed a new group. The reasons are as follows: First, China is one of the most important countries in rare earth trade, and Japan is geographically close to China. Japan has been importing rare earth from China for a long time. Second, with rising demand for rare earths, Japan-China relations have become very tight in recent years. And the United States also participates in the largest community. In addition, Australia and Malaysia are working together to form a new group. During this time, the pattern of the international rare earth trade network is clear, and the differences between the communities are obvious. Thus, the number of communities between 2005 and 2010 varied between 5 and 8, and the distribution of communities is less clear. The trade relations of the rare earths at this time are relatively complex and changeable. The reason for this observation is that the Chinese government has taken various measures to control rare earth trade, such as setting export quotas and banning the export of most of the primary rare earth products. The former communities changed. Some resource-poor countries are looking for suppliers and geographic regions to meet their demand. It is noteworthy, however, that South Africa and Vietnam gradually became active in international rare earth trade during 2000. Until 2015, the rare earth trade network has been restored to a stable structure. It is clear that there has been a trend towards trade integration. The trading network includes 81 countries, and the largest community comprises 67 countries, which makes up 83% of the entire trading network.
Fig. 9. The number of municipalities in the international network of rare earths.
Fig. 10. The community of the international rare earths network in 1996.
Fig. 11. The community of the international rare earths network in the year 2015.
Conclusion
In this study, a weighted network model for the international rare earth trade was developed, which contains data from the years 1996 to 2015. By calculating the distribution of the trading countries, the network's overall structure, the main countries of the network and the communities of the network, we can draw four important conclusions from these analyzes.
1.
The rare earth network has the typical characteristics of a scaling-free network, and the degree distribution in the log-log coordinate corresponds to the performance law. In addition, the phenomenon of the small world is present according to the average path length and the clustering coefficient.
2.
The size of the international rare earth trade network has increased in the last twenty years. The distribution of core density is clearly dextrorotatory, suggesting that most countries have about three trading partners, while few countries have a large number of trading partners. All trade relations are therefore not balanced.
3.
The model showed that the structure of the market for rare earth trade has a clear monopolistic feature. Japan, the United States, France and Germany are the major importers of rare earths. China is the largest rare earth producer and exporter. In addition, according to the weighted-score and community-calculated outcomes, the trading countries tend to connect with countries that are geographically close to their trading partners.
4.
Chinese politics has a significant impact on the structure of international rare earth trade. In recent years, the Chinese government has taken a series of measures to increase its control over rare earth production and exports, resulting in a variation in the overall structure of the rare earth trading network and the role of some trading countries.
5.
Finally, an analysis of the communities of the international rare earth trade shows that this trade shows a tendency towards integration. The number of communities in the network has varied from eight to four over the past twenty years, and the pattern of trade has become more stable.