Summary:
In this study, a method for radial crystallization cleaning under induction for the production of 6N, 7N seed crystals with ultra-high purity was presented. The influence of the cooling temperature on the morphology of the seed crystal as well as the cooling water temperature, the flow rate and the addition amount of the seed crystal on the crystallization process were investigated, and the best purification process parameters were obtained as follows: temperature of the seed crystal preparation: 278 K; Temperature and flow rate of the cooling water 293 K and 40 L · h-1; and the number of seeds added six.
The effects of temperature and flow of cooling water on the crystallization rate were investigated. The rate of crystallization decreased linearly with increasing cooling water temperature, but increased exponentially with increasing cooling water flow. The relevant equation for the crystallization rate was determined experimentally and three purification schemes were proposed. When 4 N crude gallium was purified according to Scheme I, 6 N high-purity gallium and 7 N high-purity gallium were obtained according to Scheme II and III. The purity of high purity gallium produced by the three Schemes I, II and III was 99,999987%, 99,9999958% and 99,9999958%, respectively.
1. Introduction
In the 1970s, it was discovered that compounds comprising gallium and Group IIIA elements had excellent semiconductor properties. Since then, gallium (Ga) has gradually been used as a raw material in the semiconductor industry. In recent years, with the continuous advancement of science and technology and people's pursuit of low-carbon economy and green energy, the application of Ga has been fully developed, and has become one of the most important raw materials in the field of modern semiconductors (about 80% of total gallium consumption), solar energy (about 10% of total gallium consumption), magnetic materials (~ 5% of total gallium consumption), and catalysts, and widely used in defense, optical fiber communications, aerospace and other fields. Currently, the production technology for low quality gallium (purity ≤ 99,99%) has been perfected day by day. The 2018 US Geological Survey (USGS) statistics show that the amount of low-grade primary gallium production worldwide was ~ 2017 tons in 315, a 15% increase from the 2016 amount of 274 tons. The demand for high purity gallium has increased with the development of high performance semiconductor devices, since even very small amounts of impurities such as Cu, Pb, Fe, Mg, Zn and Cr are present in the stream, large-scale commercial grade gallium can degrade or degrade electrical properties restrict. Conventional cleaning methods such as electrolytic cleaning, regional melting, vacuum distillation and single crystal pulling method were used.
For the production of high purity gallium, the electrolytic refining process is currently the most widely used technology in the industry for producing high purity gallium. However, these traditional methods had many problems such as high energy consumption, lack of environmental friendliness, low production efficiency, and uncomfortable automation control. Therefore, the development of advanced cleaning technology is very important for the development of today's semiconductor and solar industries. The purification and refining of gallium was systematically investigated by us. Based on the conventional crystallization method, a method for producing crystallization crystals induced by crystallization with seed crystals has been proposed. The process has the advantages of low energy consumption, simple equipment, convenient operation and a short production cycle. In this study, the crystallization experiment was used to investigate the influence of the cooling temperature on the morphology of the crystal and the influence of the cooling water temperature, the flow rate and the amount of seed crystal added in the crystallization process. The parameters of the cleaning process were studied to optimize the best cleaning process, to determine the crystallization rate control equation, and to produce high purity (6N and 7N) metal gallium under the process conditions.
2. Materials and methods
2.1. Process Design Image 1 shows the manufacturing process of 6N, 7N high purity gallium bicyclic crystal cleaning process by seed induction. The main steps and procedures are as follows: (1) Purifying the crystallizer and assembling the purifier First, the crystallizer was rinsed with high purity water (resistivity ≥ 16 MΩ · cm) to remove the dust on the surface. Then it was cleaned with an ultrasonic cleaner containing ultra-pure water for 2 hours to remove residual impurities on the surface. The cleaning device was assembled as shown in 1b. (2) Pretreatment of 4 N raw gallium. 4 N raw gallium was placed on a hotplate together with the packaging bottle and the heating temperature was set to 335 K. After the gallium had melted, the molten crude gallium was transferred to a polytetrafluoroethylene beaker and mixed with 200 ml of 3 mol / l HCl at 335 K for 2 hours. The hydrochloric acid was aspirated with a plastic pipette, and then 200 ml of 3 mol / l HNO & sub3; added to the beaker, followed by mixing and stirring for 2 hours. The crude gallium was washed with acid, followed by washing three times with ultrapure water. The hydrochloric acid and nitric acid used in the acid treatment were all of high purity, and ultrapure water was used to prepare the acid solution. The pretreated molten crude gallium (4N) was transferred to a clean crystallizer. Circulating cooling water was introduced into the water jacket of the crystallizer. The cooling water was supplied using a low-constant-temperature water tank and a built-in circulating pump. The temperature range was between 263 and 373 K, the accuracy of the temperature control was ± 0,1 K and the flow rate of the cooling water was controlled with a glass rotor flow meter. When the temperature of the liquid gallium dropped to the critical crystallization point, crystal seeds were added and the cooling water was circulated. These crystals were prepared using 7N gallium as a raw material to start the purification test. The procedure used is as follows: A polytetrafluoroethylene cup containing molten 7N gallium was brought to a low constant temperature to cool and crystallize the water. Liquid gallium was continuously stirred with a Teflon rod to disperse the crystal nucleus and improve the nucleation rate. During the stirring process, the crystallization of liquid gallium was observed.
A three-way switch was switched and the circulating hot water was introduced into the cooling / melting zone of the crystallizer. After the solid gallium was completely melted, the three-way switch toggled and the circulating cooling water was reintroduced into the cooling / melting zone; The hot water was supplied using a constant temperature water tank and a built-in circulation pump. The temperature range was 278–373 K and the accuracy of the temperature control was ± 1 K. The steps (as shown in Figure 1c) were repeated up to a specified number of crystallizations. After completion of the cleaning, the product quality was determined.
A three-way switch was switched and the circulating hot water was introduced into the cooling / melting zone of the crystallizer. After the solid gallium was completely melted, the three-way switch was switched and the circulating cooling water was reintroduced into the cooling / melting zone; The hot water was supplied using a constant temperature water tank and a built-in circulating pump. The temperature range was 278-373 K and the accuracy of the temperature control was ± 1 K.
The steps (as shown in Figure 1c) were repeated until a predetermined number of crystallizations. After completion of the cleaning, the product quality was determined.
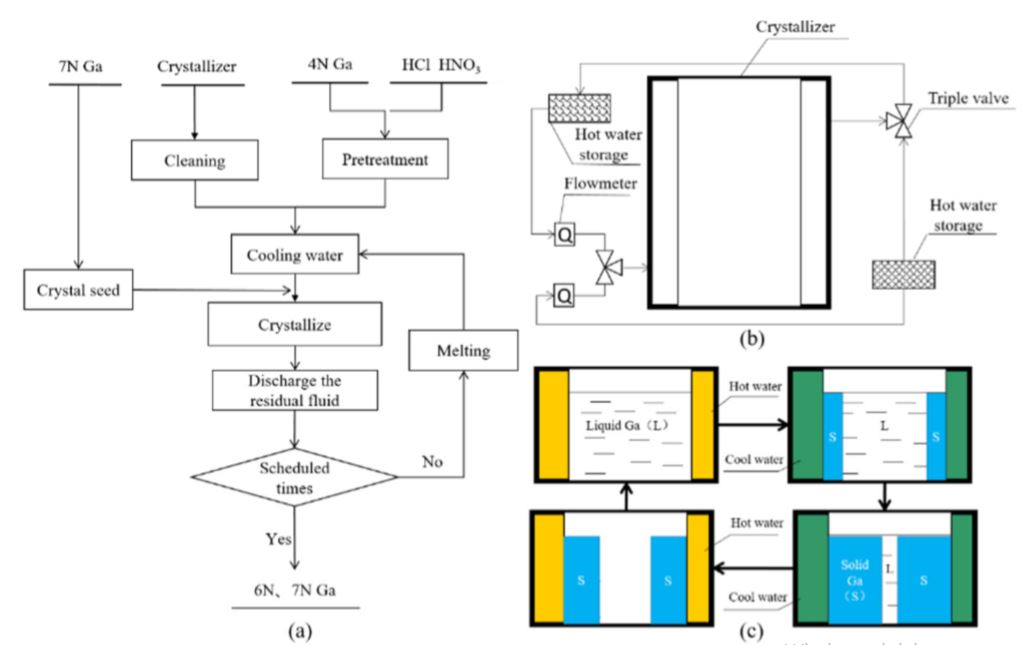
Figure 1. Schematic representation of the cleaning process: (a) process sequence for the cleaning, (b) assembly of the cleaning device and (c) repeated crystallization process.
2.2. detection methods
In the experiment, the impurity contents of the 4N gallium raw material and the purified 6N, 7N gallium were detected by high-resolution glow discharge mass spectrometry (Evans Materials Technology (Shanghai) Co., China, HR-GDMS)) and the purity of the product was determined by the difference method calculated. Argon was used as the detection gas. The mass spectrometry parameters are as follows: discharge current 1,9 mA; Discharge voltage 1 kV; Beam current of gallium ion 1 × 10⁻⁶ mA; Insulating layer, aluminum; and resolution ≥ 3600. Prior to data acquisition, the HR-GDMS ion source was cooled to the liquid nitrogen (90 K) temperature to reduce ion interference in the background gas. Then, the surface of the tested sample (0,2 x 2 mm 2) was sputtered for 5 minutes at a liquid nitrogen temperature to remove the contaminants from the sample surface. The conditions before sputtering were kept constant and data acquisition was started. During the data acquisition process, the integration time was set to 80 ms.
3. Results and discussion
3.1. Influence of the cooling temperature on the seed morphology
The appearance morphology of the seed crystal produced at a cooling temperature in the range of 265-295 K is shown in Figure 2. This shows that the solidified structure in 265 K comprised many fine crystal grains and the grains were interspersed with a large amount of liquid gallium. When the solidified structure was removed, a large amount of liquid gallium was bound to the surface, resulting in an extremely irregular shape of the seed, since in 265 K, the growth rate of the crystal nucleus after nucleation increased due to the high degree of supercooling, resulting in formation of a crystal nucleus large number of dendrites leads. The rapid growth of dendrites not only mixes with much liquid phase within the solidified structure, but also causes much hollow surface of the solidified structure. At a preparation temperature of 273 K, the solidified structure showed the geometric polyhedral shape features, indicating that as the degree of supercooling decreased, the growth rate of the crystal nucleus decreased and its growth mode switched from dendrite growth to lamellar growth. When the production temperature was 278 K, the solidified structure showed a regular hexahedral shape, indicating that with increasing temperature, the degree of supercooling of the growth front after the formation of the crystal nucleus continued to decrease and the growth mode changed in terms of growth in layers. At a preparation temperature of 295 K, the degree of supercooling of the solid-liquid interface further decreased after formation of the crystal nucleus, preventing the release of latent heat from crystallization. At this time, the growth direction of the crystal nucleus changed to side growth, distorting its geometric shape to release the latent heat of crystallization more rapidly. By comparing the morphological properties of seeds produced at four temperatures, the optimum production temperature of the seed crystal was finally determined to be 278K. At a manufacturing temperature of 273 K, the solidified structure exhibited the geometric polyhedral shape features, which indicates that as the degree of supercooling decreased, the growth rate of the crystal core decreased and its growth mode changed from dendrite growth to lamellar growth. When the production temperature was 278 K, the solidified structure showed a regular hexahedral shape, indicating that with increasing temperature, the degree of supercooling of the growth front after the formation of the crystal nucleus continued to decrease and the growth mode changed to vertical layer growth. At a preparation temperature of 295 K, the degree of supercooling of the solid-liquid interface further decreased after formation of the crystal nucleus, preventing the release of latent heat from crystallization. At this time, the growth direction of the crystal nucleus changed to side growth, distorting its geometric shape to release the latent heat of crystallization more rapidly.
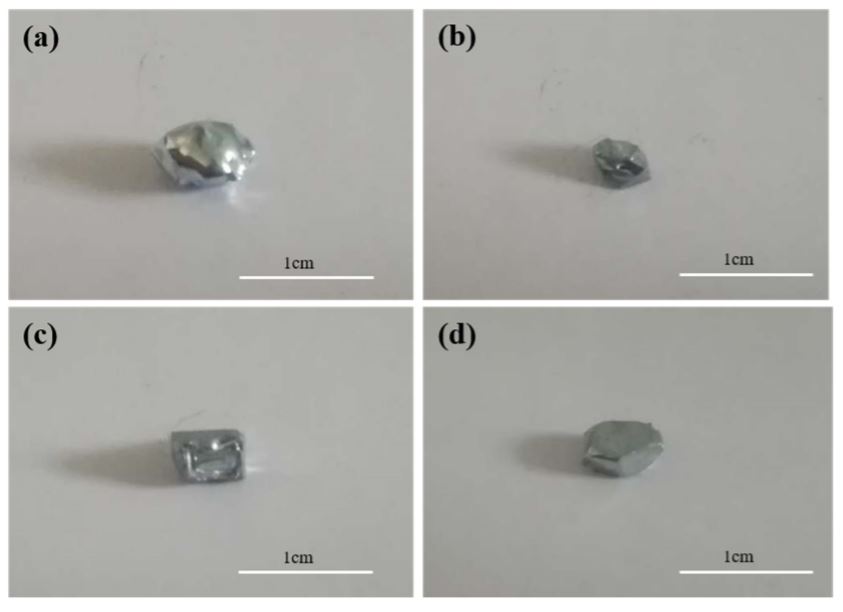
Figure 2. Morphology of the seed crystals prepared at different cooling temperatures ((a) 265 K, (b) 273 K, (c) 278 K and (d) 295 K).
3.2. Influence of process parameters on the crystallization process
3.2.1. Influence of the temperature of the cooling water on the crystallization process
When the flow rate of the cooling water was 40 L · h-1 and the temperature was in the range of 288-298 K, 2,9774 kg of raw gallium pretreated by pickling was cooled to the critical point of crystallization, followed by addition of seed for 15 minute The corresponding crystal growth morphology is shown in Figure 3.
Figure 3 shows that when the temperature of the cooling water was 288 and 290 K, the liquid gallium crystal growth mode was mainly dendrite growth after addition of the seed crystal and the crystal branches were bridged with each other, with liquid gallium trapped in the crystal. This was because at a lower cooling water temperature, the temperature gradient inside the liquid gallium was higher and the growth rate of the crystal after the addition of the seed crystal was faster. Although a positive temperature gradient was formed at this time, the temperature at the front of the solid-liquid interface in the radial direction of the crystallizer was higher, preventing the release of latent heat of crystallization in that direction and thus reducing crystal growth in that direction. However, in order to facilitate the release of latent heat of crystallization, the growth orientation of the crystal changed and rapidly grew in the form of dendrites, eventually breaking the crystal branches and bridging
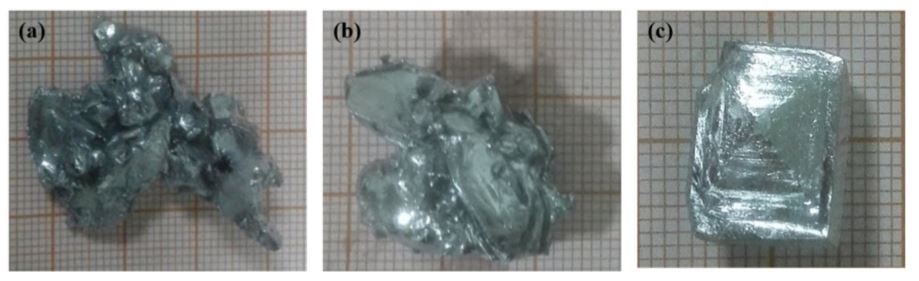
Figure 3. Crystalline morphology of liquid gallium after 15-minute addition of nuclei at different temperatures of the cooling water ((a) 288 K, (b) 290 K and (c) 293 K).
Inclusion of the liquid phase.
The entrained liquid phase contaminants can not be removed due to crystal growth, thereby affecting the purification process. When the temperature of the cooling water was 293 K, the liquid gallium grew to a monocrystal after addition of the seed crystals.
In order to further analyze the growth law of the liquid gallium during crystallization, the crystal morphology was investigated at various times after addition of the crystal nuclei by the method of dynamic time measurement at a cooling water flow of 40 L · h-1 and a temperature 293 K. The result is shown in Figure 4.
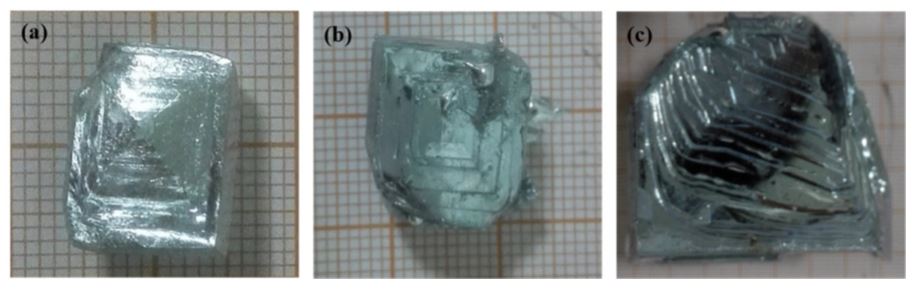
Figure 4. Morphological images of crystal blocks at different times after addition of the seed ((a) 15 min, (b) 30 min and (c) 60 min).
Fig. 4 shows that after the addition of the seed, the gallium crystal ingot gradually increased with increasing crystallization time and the liquid gallium crystal growth mode after addition of the seed crystals showed a typical layered shear growth indicating the temperature. A gradient environment formed by the cooling water at 293 K could be of the crystal growth produced latent heat of crystallization to the front of the solid-liquid interface and transfer and release them along the direction of the temperature gradient to the outside. This type of layer crystal growth was advantageous for the accumulation of impurity elements from the solid-liquid interface to the liquid phase, thereby obtaining the higher Ga solid Ga metal. The degree of supercooling of the growth peak was greatest when the crystal grew, and the liquid gallium atoms at the solid-liquid interface were preferentially bonded at the growth peak, and the heat was transferred outward from the crystallized solid gallium toward the positive temperature gradient in the crystallizer , Therefore, crystal growth in the crystallization process has always been in the form of a pyramidal stepwise progress. According to the kinetics and thermodynamics of crystal growth, the layered growth proved conducive to increasing the surface area of the crystals, facilitating the release of latent heat of crystallization, and ensuring a continuous and steady growth of the crystals during the crystallization process. In addition, according to the separation and coagulation theory of impurities in the crystal can be assumed
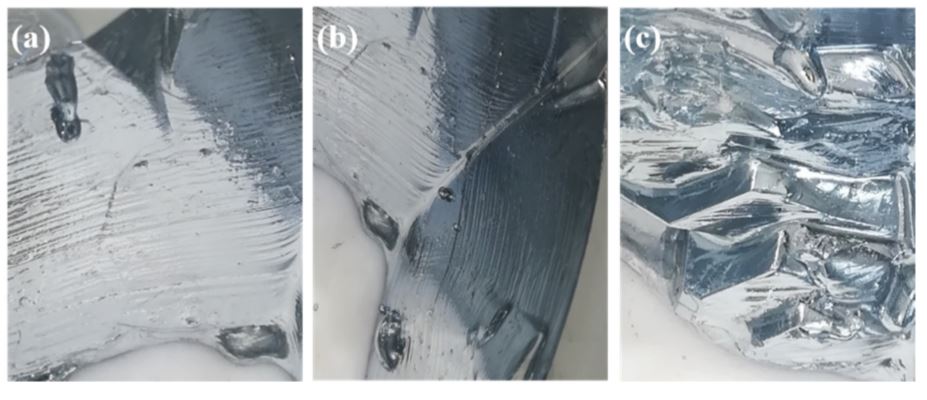
Figure 5. (a) For 30 L · h · 1 near the crystallizer outlet, (b) for 40 L · h · 1 near the crystallizer inlet, and (c) for 50 L · h · 1, the detail morphology of gallium crystal near the crystallizer inlet crystallizer clean passage.
Enrichment of impurity elements from the solid-liquid boundary into the liquid state and avoidance of impurities by liquid phase envelopes due to irregular crystal growth direction. 4 shows that with increasing crystallization time, the pyramid tip of the crystal became more apparent and the layering step of crystal growth became more evident as crystallization continued, the impurity elements accumulated constantly in the liquid phase, and the purity increased at the solid-liquid interface. what the clingability of the solid-liquid interface improved the crystal growth peak. Due to the difference in atomic radius and electronegativity between Ga and impurity elements, the impurity atoms attached to the growth peak invaded the Ga lattice or the lattice vacancy and caused the growth defect of the Ga crystal. This showed that the removal of impurity elements decreased with the progress of crystallization and coincided with the literature data.
3.2.2. Influence of the cooling water flow on the crystallization process
In a previous study, primarily the influence of the cooling water flow on the crystallization process was investigated. The results showed that the growth rate of the gallium crystal near the outlet of the crystallizer was slightly lower than in other regions when the cooling water flow rate was 30 L · h-1. When the cooling water flow rate was 50 · H - 1, the growth rate of the gallium crystal in the lower part of the crystallizer was slightly larger than that of the upper part and the growth rate near the crystallizer entrance was the largest. At a cooling water flow rate of 40 L · h-1, the growth rate of the gallium crystals was substantially the same in all regions of the crystallizer, and no local growth phenomenon was observed too fast or too slow. To further investigate the effect of this process parameter on the crystallization process, the crystal morphology of liquid gallium was observed at different cooling water flows. The results are shown in Figure 5.
This is attributed to the fact that as crystallization progressed, contaminants continuously accumulated in the liquid phase and the impurity content at the solid-liquid interface increased, increasing the likelihood of contaminant elements attaching to the crystal growth peak. Due to the difference in atomic radius and electronegativity between Ga and impurity elements, the impurity atoms attached to the growth peak invaded the Ga lattice or the lattice vacancy and caused the growth defect of the Ga crystal. This indicates that the removal of impurity elements decreases with advancing crystallization and matches the literature data.
Figure 5. (a) For 30 L · h · 1 near the crystallizer outlet, (b) for 40 L · h · 1 near the crystallizer inlet, and (c) for 50 L · h · 1, the detail morphology of gallium crystal near the crystallizer inlet crystallizer clean passage.
Figure 5 shows that the crystal morphology of gallium with a cooling water throughput of 40 L · h - 1 showed a clear “shell pattern” with a uniform grain spacing. This indicated that the gallium crystal was growing layer by layer at this flow rate and was beneficial in removing the contamination. With a cooling water flow of 30 L · h - 1, the crystal growth rate on the outlet side of the crystallizer was slightly slower than in other areas and the crystal morphology was the same as with a cooling water flow of 40 L · h - 1, with a different “shell pattern” also being displayed . This indicated that under these flow conditions the gallium crystals also grew layer by layer, which was beneficial for the removal of impurities; The crystal growth rate here, however, was slower than in the surrounding area, so that the possibility of enveloping the liquid phase as the crystallization progresses cannot be ruled out at this point. However, with a cooling water throughput
The crystal growth was larger and the crystal growth rate was faster, which changed the crystal morphology and the presence of a large number of irregular growth steps. From this it can be concluded that the crystals in the location are not grown completely in layers, and the crystal growth process may be accompanied by dendrite or peritectic formation, resulting in a liquid shell phase, including impurities and reducing solid gallium cleaning action.
3.2.3. Effect of germ count on the crystallization process
With a cooling water flow of 40 lh-1 and a temperature of 293 K, the liquid gallium cooled to the critical crystallization point was added and 3, 4, 5 and 6 seed crystals were added. When crystallization has reached a certain level, its morphological image is shown in 6, indicating that the number of seeds added determines the shape of the uncrystallized area. When three seed crystals were added, the uncrystallized area showed a triangular shape. When four nuclei were added, the uncrystallized region showed an equilateral shape. However, when the number of crystal nuclei added was 3 or 4, the shape and size of the uncrystallized region did not match and showed a funnel shape with a large top and a small bottom. This easily resulted in a point of intersection of the crystal growth at the bottom of the crystallizer with the continuous progress of crystallization, which caused the development of the liquid phase and the incorporation of impurities, thereby affecting the effect of the deflagration. When five seed crystals were added, the uncrystallized area showed a pentagonal shape, and the problem of the shape with a large upper and a small lower part in the uncrystallized area improved. In the case of adding six seed crystals, the uncrystallized area showed a hexagonal shape of regular shape and uniform size and was most advantageous for controlling the overall direction of the crystal during the purification of crude gallium. Therefore, the optimum number of seed additions was determined to be six when the 4 N raw gallium was purified using a self-made crystallizer.
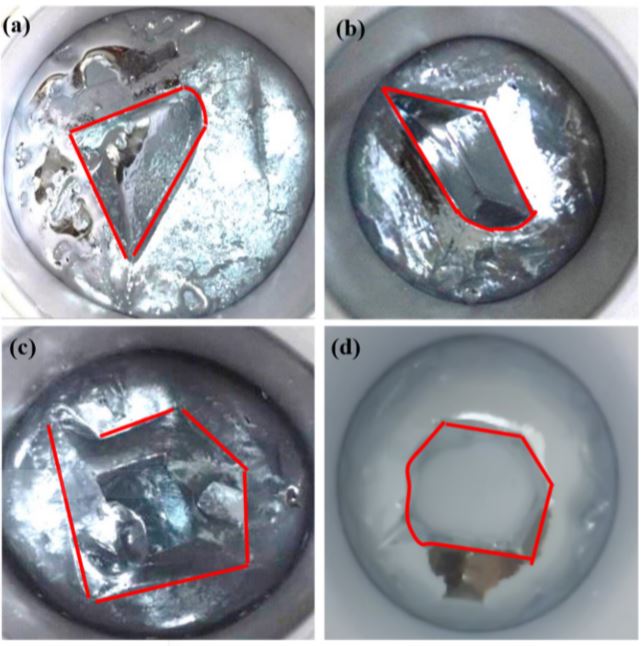
Figure 6. Photographs of the crystal morphology with addition of a different number of nuclei ((a) 3, (b) 4, (c) 5, and (d) 6).
3.3. Effect of process parameters
3.3. Influence of process parameters on the crystallization rate
In the actual crystallization solidification process of liquid gallium, the rate of crystallization (i.e., the crystal growth rate of gallium upon addition of nuclei) depended on the degree of supercooling of the solid-liquid interface. The degree of supercooling of the solid-liquid interface was a function of temperature and cooling water flow to keep other process conditions constant. In the experiment, the relationships between the crystallization rate and the cooling water temperature and the flow were measured by the control variable method, and the empirical control formula of the crystallization rate was obtained by analyzing the experimental data. In order to reduce the experimental error, improve the accuracy of the empirical control formula and its adaptability to the actual production process, each group of measurement experiments was repeated four times and the mean was formed. The crystallization rate measured in the experiment was changed during the complete solidification process of liquid gallium after addition of the seed, and the calculation formula is as follows:
v = m / t
where v is the average rate, kg / h; m is the total mass of liquid gallium, kg; t is the time required for complete solidification of liquid gallium, hour (h). The influence of temperature and flow rate of the cooling water on the crystallization rate determined by the test is shown in 7. 7a shows that as the cooling water temperature increases, the crystallization rate gradually decreases and an obvious linear relationship between them is observed. The empirical control formula of the cooling water temperature for the crystallization rate was obtained by Origin software customization.
v (T) = -0,09 T + 27
where T is the temperature of the cooling water K; and the linear correlation coefficient of the data fit was R2 = 0,997. 7b shows that as the flow rate of the cooling water increases, the crystallization rate increases and a significant exponential functional relationship between the two is observed. The empirical control formula of cooling water flow to crystallization rate was obtained by Origin software fitting.
v (Q) = -96,73e - Q 4,94 + 0,66
where Q is the flow rate of the cooling water, L / h; and the standard deviation of the data fit was R2 = 0,997.
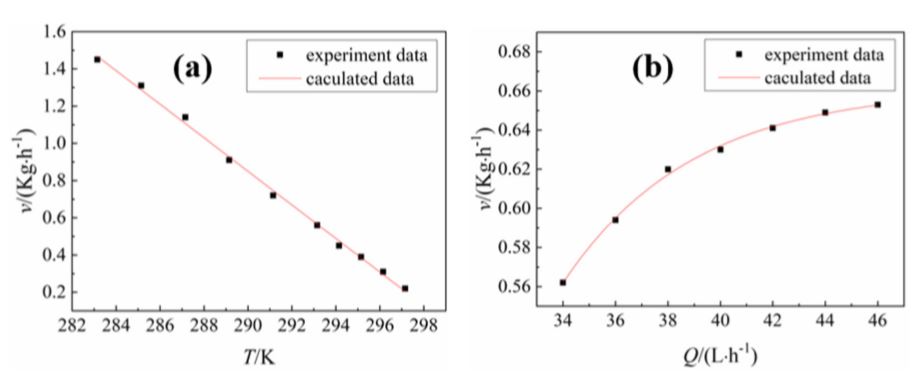
Figure 7. (a) Influence of the cooling water temperature on the crystallization rate at a flow rate of 40 L · h-1; (b) Effect of Cooling Water Flow Rate on Crystallization Rate in 293 K.
3.4. Analysis of cleaning results
Based on the above investigations, the optimal technological parameters for the crystal purification of the 4N raw material gallium were determined as follows: The temperature of the seed preparation, 278 K; Cooling water temperature, 293 K, cooling water flow rate, 40 L · h-1, and the number of seed crystals added was six. In combination with our previous research, three cleaning schemes were created
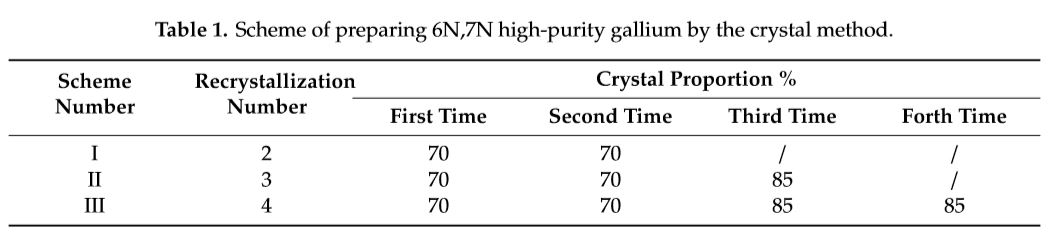
Table 1. Scheme for the preparation of 6N, 7N high purity gallium by the crystal method.
The impurity levels in high purity gallium prepared by the three purification schemes were tested and compared to the gallium raw material, and the removal rate of the impurities was calculated. The results are shown in Table 2.
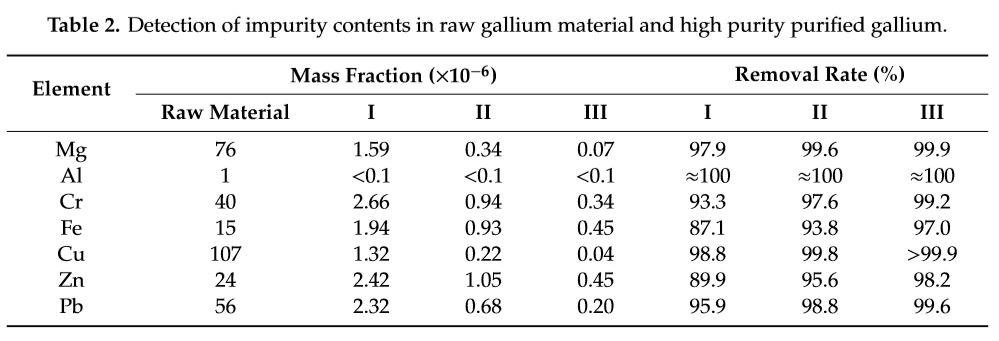
Table 2. Detection of contaminant levels in gallium raw material and high purity purified gallium.
Table 2 shows that after purification, the fractions of impurities contained in the materials were reduced below the detection limit of HR-GDMS, and the other six major impurities were also well removed. The removal rates were: Fe-87,1%, Pb-95,9%, Zn-89,9%, Mg-97,9%, Cu-98,8%, and Cr-93,3%, and the mass fraction of the aluminum metal calculated by the difference method was 99,999987%.
For Scheme II, the removal rates of the six main impurities were Fe-93,8%, Pb-98,8%, Zn-95,6%, Mg-99,6%, Cu-99,8% and Cr-97,6% and the mass fraction of the main Ga metal was 99,9999958% , For Scheme III, the removal rates of the six major impurities continued to increase and the removal rates of Mg and Cu exceeded 99,9%. In contrast, the Fe removal rate, while lowest, also reached 97%. The mass fraction of the main metal Ga was 99,9999958%.
4. Conclusions
In summary, it is proposed to eliminate the impurity of the examined Ga in detail and to perform the crystallization purification process using this crystal induction. The effect of cooling temperature on the morphology of the crystal as well as the cooling water temperature, the flow rate, and the number of nuclei added to the crystallization process under study. The optimal purging method was obtained; the control equation of the crystallization rate was determined; and the high purity (6N and 7N) gallium was produced under technological conditions. The main conclusions of this study are as follows:
- The optimum process parameters for the crystallization purification of the 4N raw material gallium are as follows: temperature of the seed preparation 278 K; Cooling water temperature 293 K; Cooling water flow 40 L · h - 1; the number of seed crystals added six 6;
- The rate of crystallization decreased linearly with increasing cooling water temperature and increased exponentially with increasing flow of cooling water. The control formulas of the cooling water temperature T and the flow rate Q over the crystallization rate v are: v (T) = -0,09T + 27 and v (Q) = -96,73e -Q 4,94 + 0,66;
- The three proposed cleaning schemes effectively removed the contaminant elements. When using Scheme I to purify the 4 crude nickel, high purity gallium with a purity of 6 N was obtained. Using Schemes II and III, 7N was given to high purity gallium. The purities of the high purity gallium prepared by Schemes I, II and III were 99,999987%, 99,9999958% and 99,9999958%, respectively.
The method proposed in the study for seed-induced radial crystallization offers the advantages of ease of operation, convenient process flow, low energy consumption, environmentally friendly and easy-to-implement automatic control of the purification process, and provides a new idea for the large scale industrial production of high purity gallium ,
Institute of rare earth metals
Department of Chemistry and Chemical Engineering, Lvliang University, China
School of Metallurgy, Northeastern University, Shenyang, China