Source: USGS
The US policy in dealing with critical minerals
President Trump and several American politicians have expressed concerns about US dependence on critical mineral imports and potential disruption to supply chains that use critical minerals for various end-uses, including defense and electronic applications. Chinese export quotas for a subset of critical minerals called Rare Earth Elements (REEs) and China's reduction in REE supplies to Japan in 2010 exacerbated concerns over US vulnerability.
In December 2017, Presidential Decree 13817, “A Federal Strategy to Ensure Secure and Reliable Supply of Critical Minerals,” mandated the Home Office to coordinate with other law enforcement agencies and publish a list of critical minerals. The Interior Ministry published a final list of 2018 critical minerals in May 35.
Concerns among many in Congress have evolved from the REEs and REE supply chains to include other minor minerals and metals used in small quantities for a variety of economically significant applications (eg, laptops, mobile phones, electric vehicles, and renewable energy technologies) and national defense applications become. Over time, concerns about access to and reliability of whole supply chains for rare earth and other minerals also increased. Congressional actions (eg National Defense Authorization Act for FY2014, PL 113-66) have led to the acquisition of REEs and other materials for the National Defense Stockpile. In the year 2017, the United States did not have primary production of 22 minerals and was limited to the by-product production of 5 minerals on the list of critical minerals. In contrast, the United States is a leading producer of beryllium and helium, and there is some US primary production of 9 other critical minerals. China ranked as the world's leading producer of 16 minerals and metals that were considered critical. Although there are not a single monopoly producer in China, China as a nation is a dominant or monopoly-like producer of yttrium (99%), gallium (94%), magnesium metal (87%), tungsten (82%), bismuth (80%), and rare earth elements (80%).
The United States is 100% import dependent of 14 minerals on the list of critical minerals (apart from a small amount of recycling). These minerals are hard-to-replace inputs into the US economy and national security applications; They include, among others, graphite, manganese, niobium, rare earths and tantalum. The United States relies more than 75% on additional 10 critical minerals: antimony, barite, bauxite, bismuth, potash, rhenium, tellurium, tin, titanium concentrate, and uranium.
The current objective of US mineral policy is to promote adequate, stable and reliable supplies of materials for US national security, economic prosperity and industrial production. US mineral policy attaches importance to the development of domestic supplies of critical materials and encourages the domestic private sector to produce and process these materials. But some raw materials do not exist in economic quantities in the United States, and the processing, manufacturing and other downstream companies in the United States may not be globally cost effective. Congress and other policymakers have several legislative and administrative options to consider when deciding whether and, if so, how they should address the US role and critical mineral deficiencies.
Preface
- President Trump and several US legislators have raised concerns about US dependence on critical mineral imports and vulnerability to critical supply chain supply chain failures for various end-use applications, including defense and electronics applications. Chinese export quotas for a type of critical mineral called Rare Earth Elements (REEs) and China's reduction of rare earth transports to Japan for a disputed 2010 dispute have given the United States a wake-up call for China's monopoly-like control of the global REE Offer.
- The measures taken by the Chinese resulted in record prices for rare earths and began to shed light on the potential supply risks and supply chain vulnerabilities for rare earths and other raw materials and metals used for national defense, energy technologies and the electronics industry, among others End uses, are needed. U.S. lawmakers have enacted laws and advised on how would account for the potential supply risk and vulnerability to rare earth supplies and bills that would encourage the development of indigenous rare earth mines. After 2010, policymakers faced a number of policy issues, including is a domestic supply chain necessary to address potential supply risks and would an alternative RRE supply chain outside of China provide reliable and less risky access to RREs among allies? As events unfolded in the 2010s, it became clear that providing upstream supplies outside of China was insufficient, and that access to and reliability of entire supply chains for rare earths and other economically and national security minerals are also at risk . Concern among many in Congress has risen from the supply chains for rare earths and rare earths to other smaller minerals or metals used in small quantities for a variety of economically significant applications.
- These by-metals are used in relatively small quantities in everyday applications such as laptops, mobile phones and electric vehicles, renewable energy technologies and national defense applications.
From 2010 to today
After China's actions in 2010 helped raise prices for the various elements, Congress initially focused on rare earth supplies (e.g., where new rare earth production could begin in the United States). Several laws have been put forward since 2010 that would leverage a variety of policy options and approaches - from planning to implementing REE productions.
In 2010, the only US rare earth mine was at Mountain Pass, CA, owned by Molycorp, Inc. From mid-1960 to 1980, Molycorp's Mountain Pass Mine was the world's leading source of rare earth oxides. However, by the year 2000 almost all of the separated rare earth metals were imported, especially from China. Molycorp, Inc. 2002 discontinued production at its mine due to China's REE oversupply and more cost-effective production, as well as a number of environmental (such as a pipeline carrying contaminated water) and regulatory issues at Mountain Pass.
Between 2010 and 2012, there were a number of environmental (such as a pipeline carrying contaminated water) on the Mountain Pass and regulatory issues, so Molycorp, Inc. 2002 discontinued production at its mine.
- How can a fully integrated supply chain be developed domestically?
- Is a domestic supply chain necessary to address potential delivery risks?
and
- Would an alternative supply chain outside of China provide reliable and less risky access to the needed rare earth elements, as China is in a monopoly-like position in all aspects of the rare earth supply chain?
Another immediate concern was the investment and skill levels required to build a reliable supply chain outside of China.
In 2012, Molycorp, Inc. reopened its Mountain Pass mine, and Lynas Corporation, Ltd. started manufacturing in Australia, adding more rare earths to the global mix - although most of the production was in light rare earths (LREEs) to build the supply chain outside of China.
In 2012, Molycorp, Inc. reopened its Mountain Pass mine, and Lynas Corporation, Ltd. started production in Australia adding more rare earths to global supply - although most of the production was in light rare earths (LREEs), heavy rare earths (HREEs) are needed for permanent magnets - the fastest growing use for Rare earth elements at this time. Permanent magnets are important components of national missile systems, wind turbines and automobiles. With prices higher, demand came back as some companies began to use fewer REEs, try substitutes, or diversify their raw material source outside of China. With China's production (including illegal production), there was more supply than demand for many of the electrical and electronic equipment, and prices fell. The Mountain Pass mine was economically unsustainable due to the sharp drop in prices and Molycorp's debt. Molycorp filed for Chapter 2015 bankruptcy protection in June 11. In June 2017, MP Mine Operations LLC (MPMO) purchased the Mountain Pass Mine for $ 20,5 million. MPMO is a US-led consortium in which the Chinese Leshan Shenghe Rare Earth Company holds a minority stake of 10% without voting rights. In 2018, MMPO is said to have resumed production at Mountain Pass. See Table 1 for the Molycorp timeline. In March 2019, the Chinese government announced a reduction in REE production quotas and suggested that REEs made in China should only be sold in China for their domestic manufacturing
Table 1. Schedule the selected Molycorp, Inc. with respect to the activities
Mid-1960er to 1990er years
Molycorp's Mountain Pass Mine was the world's leading source of rare earth oxides in the 1960-1980 years. US production began to decline rapidly in the 90 years as China's more cost-effective production began to intensify.
Until 2000
Almost all of the separated rare earth metals in the United States were imported, especially from China.
2002
Molycorp ceased production at its mine due to China's oversupply and lower-cost production, as well as a number of environmental (such as a pipeline carrying contaminated water) and regulatory issues at the Mountain Pass. Since then, the United States has lost almost all of its infrastructure in the rare earth supply chain, including intellectual capacity.
2008
Under new ownership, Molycorp started a campaign to change the rare earth position in the United States with its “mine to magnet” (vertical integration) business model.
2011
Molycorp has laid the foundation for a new separation plant at the Mountain Pass Mine to enable a proprietary oxide separation process designed to require fewer reagents and recycle wastewater. A disposal system is therefore not required.
(April) Molycorp acquired its Japanese subsidiary Santoku America in Tolleson, AZ, and renamed it Molycorp Metals and Alloys (MMA). This acquisition was part of the company's strategy to become a vertically integrated company. Both neodymium-iron-boron (NdFeB) and samarium-cobalt (SmCo) alloys have been produced which are used in the manufacture of permanent magnets. Molycorp Metals and Alloys was the only US manufacturer to produce the NdFeB alloy.
(April) Molycorp acquired an 90,023% majority stake in AS Silmet (renamed Molycorp Silmet), an Estonian rare earth element and precious metals processor.
(November) Molycorp has entered into a joint venture with Daido Steel and Japanese Mitsubishi Corporation to manufacture rare earth sintered magnets (NdFeB) in Japan, which have been sold on the world market.
2012
(June) Molycorp acquired Neo Materials Technology, Inc., based in Toronto (renamed Molycorp Canada), with equipment for processing rare earth and permanent magnet powders in China. Molycorp has resumed production of rare earths.
2015
(June) Molycorp applies for Chapter 11 bankruptcy protection.
2016
(August) Neo Performance Materials is formed after the restructuring of Molycorp as a private company. Molycorp remains an independent entity as the owner of the Mountain Pass Mine.
2017
Neo Performance Materials completes an IPO on the Toronto Stock Exchange.
2017
(June) A consortium, MP Mine Operations, LLC (MPMO) - consisting of JHL Capital Group, LLC (aka MP Materials) (65%), QVT Financial LP (25%) and Leshan Shenghe Rare Earth Company (10%) - buys Mountain Pass Mine for $ 20,5 million.
2018
(January) According to MPMO, production on the mountain pass was resumed in January 2018. At the time of this writing, the production data was not yet available.
Sources: CRS via CRS Report R41347, Rare Earth Elements: The Global Supply Chain by Marc Humphries and articles from http://www.mining.com, including “Molycorp Thrown a Lifeline” (August 31, 2016) and “Mountain Pass Sells for $ 20.5 million ”(June 16, 2017) by Andrew Topf.
As mentioned earlier, the vulnerability of RREs in question extended to critical minerals. Evaluations using a criticality matrix identified minerals (such as rare earths, cobalt, and tantalum) that may be experiencing supply shortages and endangering economics and national security. The National Research Council, the Department of Energy (DOE) and the Massachusetts Institute of Technology (MIT) have produced comprehensive criticality assessments as early as the recent discussion on the risk of mineral supply and the potential mineral demand from the energy technology sector. Many others, such as Nassar, Du, and Graedel, have been addressing the issue of criticality and supply risk since 2010, and offer a variety of models that examine the supply risk and the vulnerabilities associated with these minerals. It is not within the scope of this report to rate these models.
Congress interest
Proposed congressional findings that are mentioned in a series of bills since the 111. Congress on Critical Minerals, include:
Emerging economies are increasing their demand for rare earths as they industrialize and modernize;
A variety of minerals are essential for economic growth and infrastructure;
The United States has huge natural resources but at the same time becomes increasingly dependent on imports;
Raw material exploration in the United States accounts for about 7% of the world total (compared to 19% in the early 90 years);
Heavy rare earth elements are crucial for national defense;
China has monopoly-like control over the rare earth value chain, and there has been a technology transfer from US companies and others to China to gain access to rare earth and downstream materials;
Thorium regulations are an obstacle to the development of rare earths in the United States;
A congressional awareness that China could disrupt United States supplies of rare earths and other critical minerals;
It is important to develop the domestic industrial base for the production of strategic and critical minerals; and
The United States must take some risk in the form of aid for domestic investment opportunities.
The Senate Energy and Natural Resources Committee held a hearing on May 14, 2019 on p. 1317, the American Mineral Security Act, “Examining the Path to Achieving Mineral Security.” The 115th Congress held two Congressional hearings on critical minerals : one on December 12, 2017 by the House's Energy and Mineral Resources Subcommittee on "Investigating the Consequences of America's Dependence on Foreign Minerals," and a second on July 17, 2018 by the Senate Energy and Natural Resources Committee on examining the final list more critically Minerals.
12 There were two Congressional hearings on critical minerals in the 115th Congress: one on December 12, 2017 by the House's Energy and Mineral Resources Subcommittee on "Investigating the Consequences of America's Dependence on Foreign Minerals," and a second on July 17 2018 by the Senate Energy and Natural Resources Committee to review the final list of Critical Minerals.
Options for creating reliable supply chains for these minerals and metals include options for public resource and mineral sector policies. The government and many congressional representatives have grouped concerns about import dependency and domestic supply development into a series of policy proposals aimed at simplifying the process of licensing domestic critical mineral production and possibly opening up more public space for mineral exploration. A report by the US Geological Survey (USGS) 2017, Critical Mineral Resources of the United States, presents its mineral ratings of 23 critical minerals to the nation as a whole, but does not disclose what might be available in the states where many of them exist Legislative proposals are addressed. Others in Congress want to be sure that if a more efficient licensing procedure is put in place, all mechanisms for environmental protection and public influence will remain intact, if not even improved.
The scope of this report
This report examines the process by which the list of critical minerals was compiled, why these minerals are considered critical, where production takes place, and in which countries the largest reserves of critical minerals exist. It gives a brief overview of the material requirements for lithium-ion batteries as well as solar and wind turbines and a discussion on the supply chains for rare earths and tantalum. This report also includes the legal and regulatory framework for domestic mineral production, legislative proposals, initiatives (and actions) by Congress and the executive, and an overview of US critical minerals policy.
There are a number of policy issues related to critical US minerals, such as trade policy (especially China) and conflict minerals, to name but two. The handling of these questions goes beyond the scope of this report.
Brief History of US Critical Minerals and Materials Policy
Minerals for national security have long been a concern in the United States. For example, there were concerns about the lack of lead for bullets in the early 1800 years. During World War II and the Korean War, there were material shortages that contributed to the formation of national defense stocks. The current supply of strategic and critical minerals and materials has been developed to address national emergencies related to national security and defense issues; it was not created as an economic reserve.
1939, after the invasion of Germany in Poland, the 1939 Strategic Materials Act (50 USC §98, PL 76-117) authorized the US to create a strategic stock of materials. 1946 was then enacted the Strategic and Critical Materials Stockpiling Act to prepare the United States for national military emergencies and prevent material shortages. The law of 1946 (PL 79-520) set a target of 2,1 billion dollars in materials that should be spent on warehousing. Congress increased its stockpile inventory to 4 billion dollars over four years (1950-1953). The 1950 Defense Production Act (50 USC §4501, PL81-774) added $ 10 billion to 8,4 to expand its supply of strategic and critical materials.
1951 formed the Materials Policy Commission (also known as the Paley Commission) for President Truman, which recommended a stock of strategic materials and the use of cheaper foreign sources. President Eisenhower set long-term storage targets during a national emergency to prevent shortages during World War II and the Korean War.
The initial timeframe for the duration of the emergency, which was to cover inventories, was three years, but was later reduced to one year. However, with the adoption of 96's Strategic and Critical Minerals Stockpiling Revision Act (PL 41-1979), a three-year military contingency has been restored as a criterion for storage targets. The financing of the stocks was subsequently increased to 20 billion dollars.
During the Cold War era, the National Defense Stockpile (NDS) had a wealth of strategic and critical materials. In the early 90s, after the Cold War with the Soviet Union, the US Congress supported the modernization and modernization of strategic stockpiles. Until the 1993 fiscal year, the National Defense Authorization Act (NDAA) for the 1993 (PL 102-484) financial year approved a large sell-off of 44's obsolete and surplus materials on the stock levels such as aluminum metal, ferrochrome, ferromanganese, cobalt, nickel, silver, tin and Zinc. Most of these materials were sold to the private sector. The proceeds from these sales have been transferred to other federal or defense (DOD) programs.
The modern stock
1988 commissioned the Undersecretary of State for Procurement, Technology and Logistics to manage the warehouse inventory and operational activities of the NDS to the Director of the Defense Logistics Agency (DLA). Among other things, the DLA manages the ongoing operation of the warehouse program.
The current inventory contains 37 materials valued at 1,152 billion dollars. Much of the materials are processed metals or other downstream products such as cumbium (niobium) metal bars, germanium metal, tantalum metal, metal scrap, beryllium rods, quartz crystals, and titanium metal.
Congressional action as of 2014 led to the acquisition of REEs and other materials for the NDS. The DLA acquires six materials based on the NDAA for the 2014 financial year: ferro-niobium; dysprosium metal; yttrium oxide; Cadmium zinc Telluridsubstrate; Lithium-ion precursor; and triamine trinitrobenzene.
In the 2016 financial year, DLA made progress on its targets for high-purity yttrium and dysprosium metal in the 2014 financial year. The NDS initiated a program to develop economical methods for recycling refuse derived fuel from scrap and waste. The aim was to explore technologies to determine whether recycling in the United States is possible. Work on this project goal is ongoing.
In addition to acquisitions and upgrades, the Congress approved a proposal from the DOD to sell materials that were considered beyond program needs under the FY2017 NDAA (PL 114-328).
Initiatives and measures on critical minerals
Development of the list of critical minerals
EO 13817, "A Federal Strategy to Ensure Secure and Reliable Supply of Critical Minerals", published on December 20, 2017, instructed the Department of the Interior (DOI) to coordinate with other offices to draft a list of the in the federal register published critical minerals 60 days after the first edition. On December 17, 2017, the Secretary of the Interior issued Secretariat Ordinance (No. 3359, Critical Mineral Independence and Security) instructing the US Geological Survey (USGS) and the Bureau of Land Management (BLM) to compile the list. DOI agencies, in cooperation with others (e.g. DOD, DOE and members of the National Science and Technology Council Subcommittee on Critical and Strategic Mineral Supply Chains [CSMSC]), developed a non-ranking list of 35 minerals according to certain criteria. The Minister of the Interior issued the final list of critical minerals in May 2018.
The USGS used the critical mineral early warning method developed by the CSMSC as a starting point for the list design. One of the metrics used was the Herfindahl-Hirschman index, which measures the concentration of production by country or company. Another metric used was the Worldwide Governance Index, which was used to determine the political volatility of a country and is based on six indicators. The early warning methodology is a two-step process. The first level uses the geometric mean of three indicators to determine if the mineral is potentially critical: supply risk (production concentration), output growth (change in market size and geological resources), and market dynamics (price changes). The second stage uses the first-stage results to determine which of the potentially critical minerals require in-depth analysis.
In developing the list, the USGS also relied on its net import relocation data; his Professional Paper 1802, NDAA FY2018 (PL 115-91) from the DOD; US Energy Information Administration (EIA) Uranium Data; and the input of several experts. The USGS set a threshold above which the minerals were classified as critical. Some minerals below the threshold, which had critical applications, were also included in the list. The USGS used supply chain analysis to include some metals, such as aluminum, as the United States relies on 100% on bauxite, the primary source mineral for aluminum production.
The unclassified list of 35 minerals does not indicate the level of criticality for some over others. This is significant in that some earlier studies had shown that the reserves of platinum group metals, REEs, niobium and manganese are potentially much more vulnerable than lithium, titanium and vanadium. In addition, the REEs are not broken down by elements. Some of the heavy rare earth elements have proven to be more critical and susceptible to supply shortages than some of the lighter elements.
Other federal measures for critical minerals
In addition to developing a list of critical minerals, Congress and various executive bodies have invested in other activities related to critical minerals. Investing in research and development (R&D) is seen by many experts (e.g. DOE, MIT, and elsewhere) as critical in supporting and developing new technologies that address three main areas: greater efficiency in the use of materials, substitutes or alternatives for critical minerals, and recycling critical minerals. Below you will find a summary of selected current R&D and information and analysis activities of the federal government on critical minerals at federal authorities.
Department of energy
Turntable for critical materials
The DOE's budget application for the 2019 fiscal year included funding for research and development on rare earths and other critical materials. The DOE's "Critical Materials Hub" conducts R&D on a number of critical materials challenges, including "End of Life" recycling to minimize potential disruptions to the REE supply chain. Funding for the program has been $ 2017 million per year for the past three fiscal years (FY2019-year25) as FY2019 is the third year of its second five-year research phase. Congress approved this support despite the Trump administration's proposal to abolish the program in FY2019 and FY2020. The critical materials hub is funded by the Advanced Manufacturing R&D Consortia under the DOE Energy Efficiency and Renewable Energy Program.
REEs from coal
Additionally, in fiscal 2019, DOE proposed to launch its critical materials initiative under the Fossil Energy R&D program under the Advanced Coal Energy Systems program to explore new technologies to recover e-waste from coal and coal by-products. Congress had provided funding for this project during the Obama administration during the National Energy Technology Lab's (NETL) R&D program, although no application for funding was made. For fiscal year 2019, the Trump Administration filed for $ 30 million in funding for the Critical Materials Initiative; Congress decided to support the initiative with $ 18 million.
Report on critical minerals
In December 2010 and December 2011, the DOE published reports on the strategy for critical materials. These reports examine and deliver demand forecasts for rare earths and other elements needed for numerous energy and electronics applications. An update on this research is under preparation, according to DOE.
Ministry of the Interior
The USGS National Minerals Information Center provides an annual summary of critical mineral activities in its Mineral Commodities Summaries Summary Report and Minerals Yearbook. The USGS also provides mineral resource assessments and has released a study on 2017 mineral resources to 23, all of which have been rated critical by the government. In the year 2010, the USGS published a report on the rare earth potential in the United States. In 2017, the USGS, in collaboration with the state of Alaska, issued a report on critical and valuable minerals in Alaska and conducted a spatial analysis that identified critical mineral potential in Alaska. The results of the analysis provided new information about areas in Alaska that could contain deposits of critical minerals.
Ministry of Defense
In a DOD-led assessment of the US manufacturing and defense industry's industrial base and supply chain stability, there are sections on critical minerals and implications for national security. The DOD continues to meet its inventory targets for various critical materials and has funded small R & D related rare earth projects.
In 2009, the Office of Industrial Policy reviewed the supply chain for rare earth minerals. The Defense Secretary's Office reviewed its national defense stockpile and issued a report entitled Reconfiguration of the National Defense Report to Congress.
As part of the Ike Skelton National Defense Authorization Act for Fiscal Year 2011 (Section 843 of PL 111-383), the DOD was requested by Congress to prepare an "Assessment and Plan for Critical Rare Earth Materials in Defense Applications" and by July 6, 2011 to report to a number of congressional committees. Assessment by the DOD and congressional funding supported new camp goals for HREEs.
In an April Bloomberg News interview with 2012, DOD's director of industrial policy said that the DOD uses less than 5% of the rare earths used in the United States, and that the DOD closely monitors the market for rare earth materials to identify projected deficiencies or failures in meeting the deployment requirements.
Office for Science and Technology Policy in the White House
In 2010 the White House Office of Science and Technology Policy (OSTP) formed an Interagency Working Group on Critical and Strategic Minerals Supply Chains. The group's focus is on setting critical mineral priorities and as an early warning mechanism for deficits, setting federal R&D priorities, reviewing national and global policies related to critical and strategic minerals (e.g. storage, recycling, trading, etc.) and ensuring the Transparency of information.
The White House National Science and Technology Council's Subcommittee on Critical and Strategic Mineral Supply Chains has produced a report describing a screening methodology for assessing critical minerals. The “Early Warning Screening” approach for material supply problems was first included as a US policy goal in the National Materials and Minerals Policy, Research and Development Act of 1980 (30 USC §1601) (PL 96-479).
Supply: production and resources of critical minerals
Production / Delivery
According to the USGS Mineral Commodity Summaries Report 2019, China ranks as the number one producer of 16 minerals and metals classified as critical. Although there are not a single monopoly producer in China, China as a nation is a monopolar producer of yttrium (99%), gallium (94%), magnesium metal (87%), tungsten (82%), bismuth (80%), and rare earth elements (80 %). China also produces about 60% or more of worldwide graphite, germanium, tellurium and fluorspar. In the year 2017, the United States had no primary production of 22 minerals and no by-product production of five minerals on the list of critical minerals. There is some US primary production of nine minerals, and the United States is a leading producer of beryllium and helium (see table 2, Figure 1).
China had production gains that were well above the rest of the world. In 2003, China had already dominated the production of graphite, indium, magnesium compounds, magnesium metal, REEs, tungsten, vanadium and yttrium, consolidating its production status as number one about a decade later. Not only are Chinese producers seeking to expand their domestic production capacity, but they continue to negotiate long-term supply contracts or equity partnerships around the world, particularly in Africa (cobalt and tantalum), Australia (lithium) and South America (lithium).
The dominant production region for chromium, manganese, platinum group metals, tantalum and cobalt is southern Africa. Brazil produces 88% of the world's niobium, and Australia accounts for 58% of global lithium production, according to USGS data. According to USGS data, critical minerals are dominated by a single producing country: niobium from Brazil, cobalt from the Democratic Republic of Congo (DRC), platinum group metals from South Africa, REEs (including yttrium) and tungsten from China.
Production of minerals and mineral raw material potential in the federal state
Up-to-date information on mineral production in the federal state is not available at the DOI. The Government Accountability Office (GAO) stated in a report from 2008 that the DOI has no authority to collect information from mine operators on the amount of minerals produced or the amount of mineral reserves on public land, and there is no obligation for Operator to report production information to the federal government.
However, previous DO50 and GAO51 reports, completed in the early 90s, reported that gold, copper, silver, molybdenum, and lead were the five dominant minerals that existed in federal states under the General Mining Law of 1872 (30 USC §). §21-54) were promoted. Currently, the vast majority of mining activities on state gold for Nevada, based on previous DOI information. The DOI report also showed that federal state mineral production was about 6% of the value of all minerals produced in the United States. There is uncertainty about how much minerals are produced in federal areas. Most minerals classified as critical are locatable by the General Mining Law of 1872 to US states; Comprehensive information about which minerals are located and produced in federal states are incomplete. An open question is to what extent there is a critical mineral resource potential in the state. Until more is known from mineral resource assessments of federal land, it will be difficult to determine the impact of the opening of federal land for development, which is now being taken out of mineral development.
Some proponents of mining are supporting the development of local supply chains for critical minerals. Other stakeholders support a diversified portfolio of reliable suppliers, especially when foreign sources are more economical or when domestic production (or manufacturing) is uneconomic, technically unworkable or ecologically unacceptable.
In addition to product supply
There are six critical minerals classified as by-products: indium, tellurium, gallium, germanium, cobalt and rhenium. There are important differences between major product and by-product supply. The supply of by-products is limited by the performance of the main product. For example, the amount of indium that can be produced in zinc must not exceed the amount of indium in zinc ore. As the production of the main product continues, the supply of by-products may be limited as a higher price of the by-product does not directly increase its supply. Even in the long term, the amount of by-products that can be extracted economically from the ore is limited. That is, the byproduct supply is relatively inelastic (ie, does not particularly respond to price increases of the by-product). For by-products, it is the price of the main product, not the byproduct that stimulates efforts to increase supply. But a sufficiently high by-product price can promote new technologies that allow better recovery of by-products from the main product. It may happen that the main product supply contains more by-products than needed to meet demand. In this case, the by-product processing plants would have to be expanded so that by-product processing capacity does not become a limiting factor in the by-product supply.
Another important difference between by-product and main product is that only the costs associated with by-product production affect by-product supply. Common costs (costs associated with manufacturing both products) are borne by the main product and do not affect the supply of by-products. By-products are usually available at lower cost than the same product that is produced elsewhere as a major product (eg, REEs produced as a by-product of iron ore in China would have lower production costs than REEs elsewhere in the world produced as the main product).
By-products are generally not free products, which means they are costly to manufacture. By-products can be free if two conditions are met:
(1) The preparation of the main product must require the separation of the by-product, and
(2) after separation, no further by-product processing is required.
Global mineral production
Table 2 contains data on the global production of critical minerals and the leading producing countries. The data show that production has increased for almost all critical minerals since 2000, many of which doubled in production (eg, chromium, indium, lithium, manganese, niobium, and tantalum) or tripled (eg, cobalt, gallium, and tellurium) ).
Table 2. Critical Minerals: Global Production and Leading Producers, Selected Years
(Data in tonnes (mt) or million tonnes (mt) unless otherwise stated)
| Mineral | Global Production | Leading Producers in 2017 |
Comments | |||
| 2000 | 2010 | 2017 | ||||
| Aluminum (bauxite) | 135.0 mt | 209.0 mt | 309 mt | Australia (28.5%), China (22.6), Brazil (12.5%), Guinea (15%), Others (21.4%) |
No bauxite produced in the United States | |
| Antimony | 118,000 mt | 167,000 mt | 137,000 mt | China (72%), Others (28%) | Relatively little US production; none reported in 2017 | |
| Arsenic | 33,900 mt | 52,800 mt | 34,600 mt | China (69%), Others (31%) | No US production | |
| Barite | 6.2 mt | 7.85 mt | 8.7 mt | China (37%), India (18%), Others (45%) |
No US production | |
| beryllium | 280 mt | 205 mt | 210 mt | US (71%), Others (29%) | US is a net exporter | |
| Bismuth | 5,880 mt | 8,900 mt | 17,100 mt | China (73%), Others (27%) | No US production | |
| cesium | NA | NA | NA | NA | No US production | |
| Chromium | 14.4 mt | 23.7 mt | 30.2 mt | South Africa (46.2%), Kazakhstan (12.9%), Others (40.9%) | No US production | |
| Cobalt | 33,300 mt | 89,500 mt | 120 mt | DRC (61%), Others (39%) | Some US production as byproduct of copper | |
| Fluorspar | 4.5 mt | 6.0 mt | 5.7 mt | China (61%), Mexico (18%), Others (21%) |
No US production | |
| gallium | 100,000 kg | 182,000 kg | 320,000 kg | China (94%), Others (6%) | Small amount of low-grade gallium as a US byproduct | |
| germanium | 71,000 kg | 118,000 kg | 106,000 kg | China (57%), Others (43%) | Small amount of US production as byproduct of zinc ore | |
| Graphite (Natural) | 571,000 mt | 925,000 mt | 897,000 mt | China (75%), Brazil (10%), Others (15%) | No US production | |
| Hafnium | NA | NA | NA | NA | Lake zirconium | |
| Helium | 98 million cubic meters (mcm) | 75 mcm | 160 mcm | US (57%), Qatar (28%), Algeria (8.7%), Others (6.3%) | US is a leading producer | |
| indium | 335 mt | 609 mt | 714 mt | China (40%), South Korea (31.5%), Others (27.5%) |
Data is for refinery production | |
| Lithium | 14,000 mt | 28,100 mt | 38,000 mt | Australia (58%),
Chile (21%), China (9.8%), Argentina (8.3%), Others (2.9%) |
Some US production | |
| Magnesium Metal | 368,000 mt | 757,000 mt | 1.1 mt | China (89%), Others (11%) | Some US production | |
| Manganese | 7.28 mt | 13.9 mt | 17.3 mt | South Africa (31%), Australia (16%), Gabon (12.7%), China (9.8%), Others (30.5%) | No US production | |
| Niobium | 32,600 mt | 62,900 mt | 69,100 mt | Brazil (88%), Others (12%) | No US production | |
| Platinum | 155,000 kg | 192,000 kg | 199,000 kg | South Africa (72%), Russia (11%) | The data in this row represents platinum only. Palladium production of 225,000 kg is split between two major producers - South Africa (39%) and Russia (38%). Small amount of US production | |
| Potash | 25.3 mt | 33.7 mt | 41.4 mt | Canada (29%), Russia (17.6%), China (13%), Others (40.4%) | Relatively small US production (roughly 1%) | |
| Rare Earth Elements | 83,500 mt | 133,000 mt | 132,000 mt | China (80%), Australia (14%), Others (6%) | No production in 2017. The USGS estimates US production at 15,000 mt in 2018. | |
| rhenium | 28,400 kg | 47,200 kg | 51,600 kg | China (55%), Poland (19%), US (17%), Others (9%) | Relatively small amount of US production as byproduct of copper recovery | |
| Rubidium | NA | NA | NA | NA | No US production | |
| scandium | NA | NA | NA | NA | No US production | |
| Strontium | 520,000 mt | 405,000 mt | 255,000 mt | Spain (35.3%), Mexico (28%), China (19.6%), Iran (15.7%) | No US production | |
| Tantalum | 836 mt | 681 mt | 1,810 mt | DRC (42%), Rwanda (24%), Nigeria (8.5%), Others (25.5%) | No US production | |
| Tellurium | 125 mt | NA | 470 mt | China (68%), Japan and Russia about 12% each, Others (9.2%) |
Some US production as byproduct of copper and lead recovery | |
| Tin | 238,000 mt | 256,000 mt | 313,000 mt | China (29.7%), Indonesia (26.5%), Burma (15%), Others (28.8%) | No US production | |
| Titanium | 4.3 mt | 6.4 mt | 5.5 mt | South Africa (18%), China (15%), Canada (16%), Australia (13%) |
Relatively small amount of US production | |
| Tungsten | 37,400 mt | 68,800 mt | 82,100 mt | China (82%), Others (18%) | No US production | |
| Uranium | NA | 1,506 mt | 1,021 mt | Kazakhstan (39%, Canada (22.5%), Australia (10%) | Some US production | |
| vanadium | 43,000 mt | 57,600 mt | 71,200 mt | China (56%), Russia (25%), South Africa (11.2%) |
No US production | |
| Zirconium | 1.04 mt | 1.25 mt | 1.55 mt | Australia (32.5%), South Africa (24.3%), China (9%), Others (34.2%) |
Some US production | |
Source: USGS, Mineral Commodity Summaries, 2019. Data on uranium from the Energy Information Administration.
Notes: kg = kilograms; NA = not available. DRC = Democratic Republic of the Congo; USA = United States.
The table uses 2017 data from the USGS Mineral Commodity Summaries report, 2019, because the report contains actual data for 2017 and only estimated data for 2018.
Some countries may be listed as leading producers, but are not listed as leading reserve holders of the same mineral in table 4.
Figure 1. Critical Minerals: Global Production (2017)
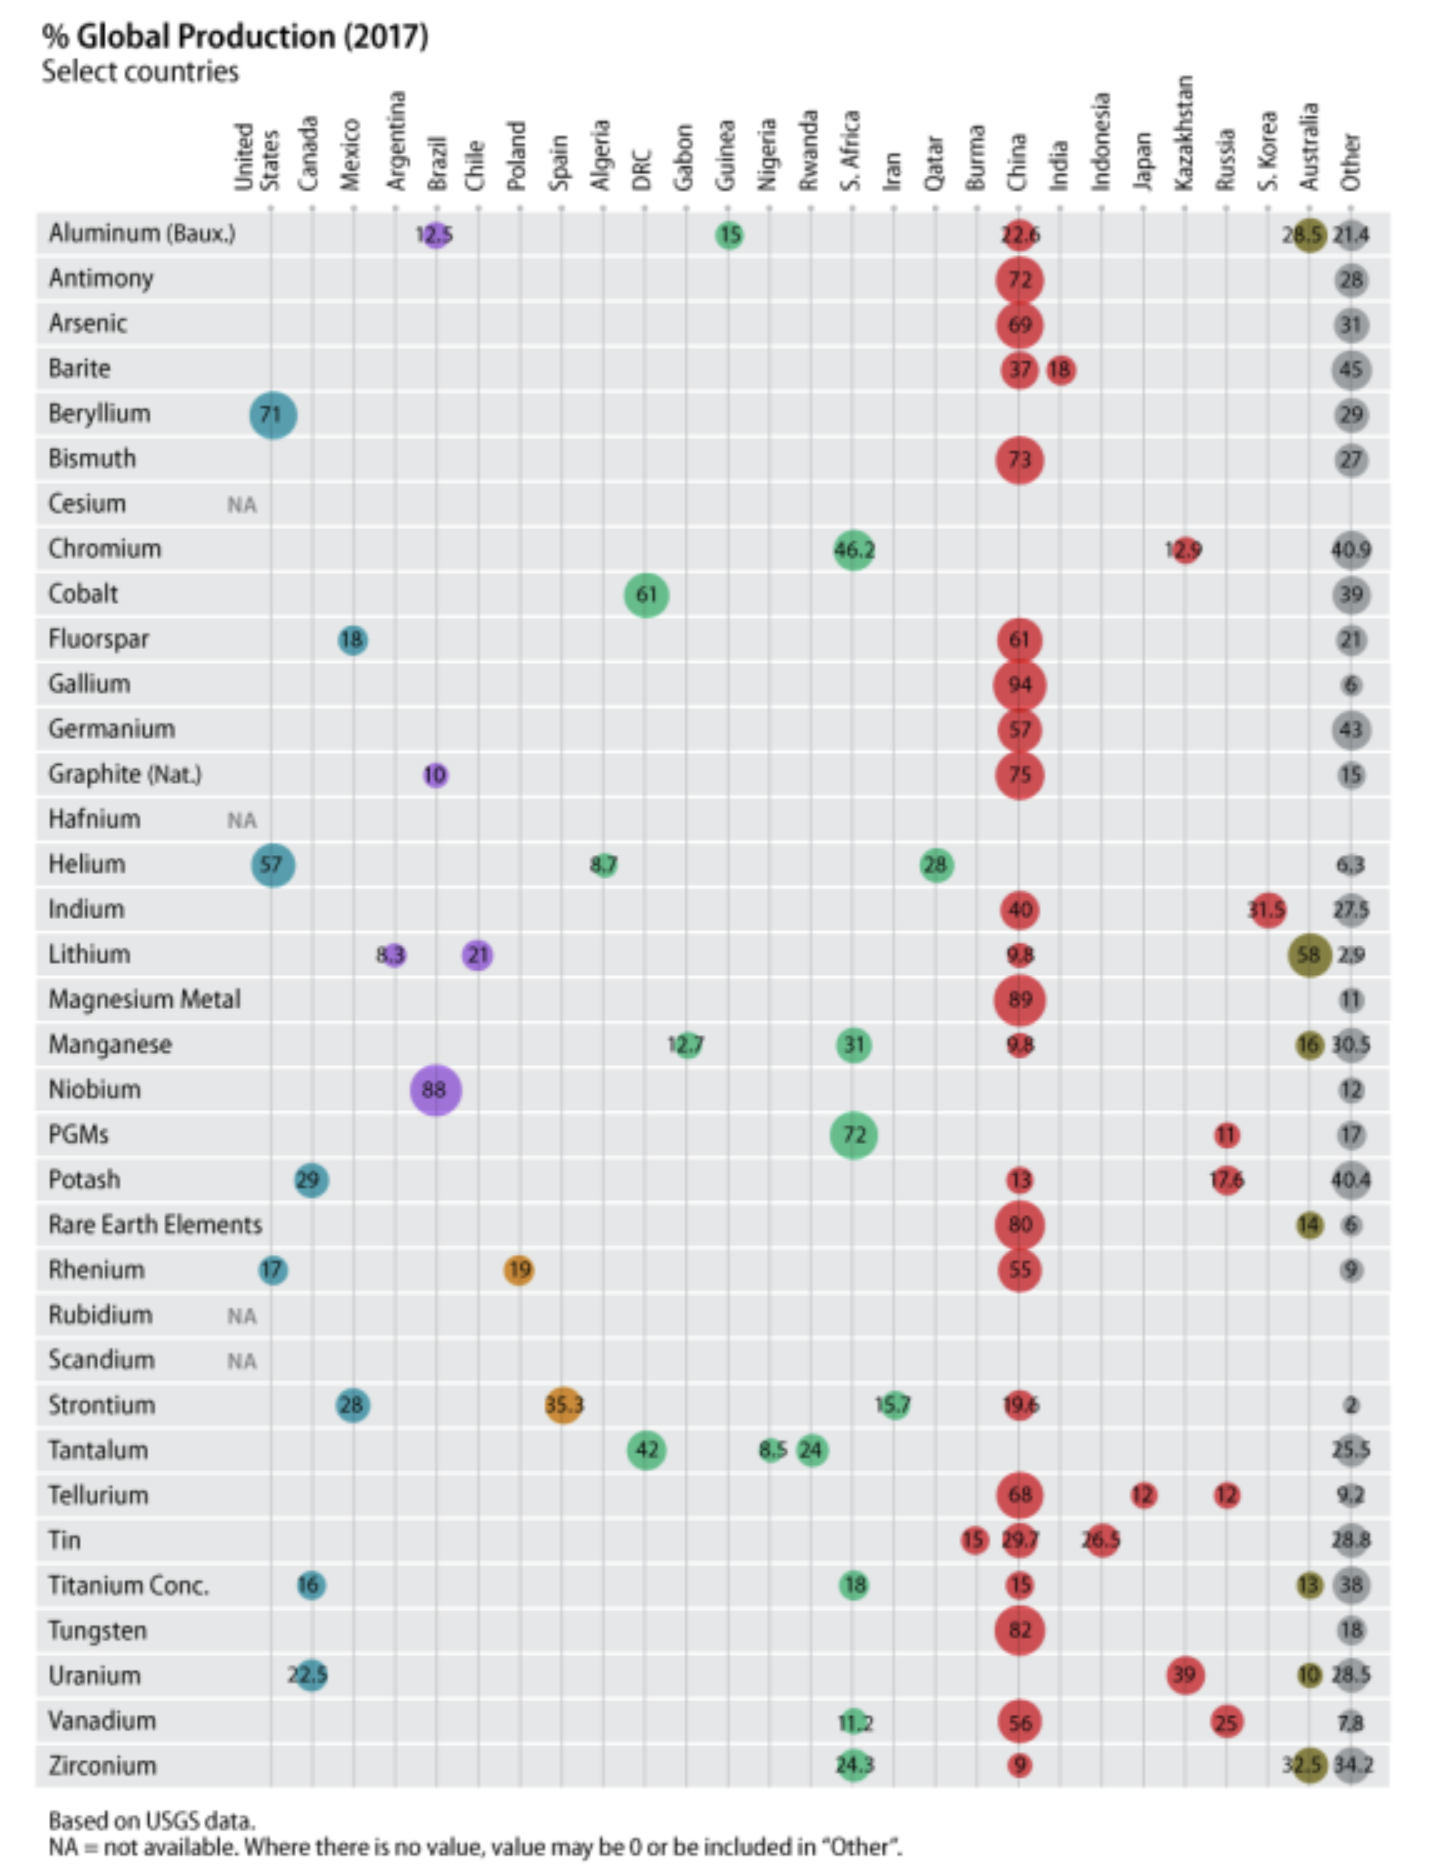
QSource: CRS-generated illustration based on USGS Mineral Commodity Summaries, 2019.
Notes: Color Codes: Blue = North America; Purple = South America; Orange = Europe; Green = Africa & Middle East; Red = Asia and Russia; Dark green = Australia; and gray = other countries not specifically mentioned in the previous columns.
Secondary reprocessing of critical minerals in the United States
Secondary recovery can be from waste products during metal refining and production or from discarded end products. As shown in Table 3, in the United States, many (but not all) of the critical minerals with high net import dependency currently have little to no production or reserves and little to no secondary recovery.
In the United States, there is a significant amount of secondary recovery of nine critical minerals according to the USGS Mineral Commodity Summaries: aluminum, chromium, cobalt, gallium, indium, magnesium metal, platinum group metals, tin, and titanium. While the US capacity for secondary recovery of metals and other materials between 1997 and 2016 has not grown strongly, recovery rates vary each year. Steel is the most commonly recycled material in the United States. For selected metals such as steel, copper, aluminum, cobalt and chrome, there are well-developed infrastructures for old and new scraps. For many other metals, such as manganese, rare earths and niobium, there is little recycling in the United States because it is economically or technically unsustainable. Countries in the European Union, Japan and South Korea are stepping up their efforts for a secondary recovery as emerging economies (eg China and India) seek better access to primary materials.
The amount of most metals and materials available for recycling is likely to continue to meet a fraction of demand, especially as demand increases. The availability rate (i.e. based on the useful life of the product) limits the recyclability. According to the National Research Council, the main obstacle to secondary recovery in the United States is the lack of clear guidelines and programs at all levels of government to aid recovery of materials. Without a national mandate, the National Research Council report shows that state and local governments are likely to continue a “patchwork” of programs and policies.
Table 3 illustrates the point that there is very little secondary recovery of critical minerals and metals in the United States. The data could indicate that there is a lack of infrastructure for the secondary recovery of critical minerals and metals. Economic and technological factors also need to be assessed as to whether the benefits outweigh the costs of recovering certain materials, in particular the low levels of critical minerals that may be available for secondary recovery (from production waste or end products). Additional research and development may be required to determine whether secondary production of the most import-dependent minerals can be increased to reduce US import dependency.
In 2018, the USGS reported that the recycling rates for base metals and precious metals are very different. For example, the recycling rates were 28% for aluminum, 35% for copper, 52% for nickel, 18% for silver and 25% for zinc. In 2014, steel was 106% recycled in the automotive industry - more steel than was used for domestic production. The recycling rate for steel is 90% for devices containing steel and 67% for steel cans.
Table 3. US Secondary Recovery of Critical Minerals, 2017
| Mineral | Secondary Recovery as% of US Apparent Consumption (unless otherwise noted) |
Comments |
| Aluminum | 28% | |
| Antimony | Unknown | Majority of US supply is from secondary sources |
| Arsenic | None reported | |
| Barite | None reported | |
| beryllium | 20%-25% | |
| Bismuth | <5% | Both old and new scrap |
| cesium | Unknown | Some formate brines reprocessed |
| Chromium | 29% | |
| Cobalt | 29% | No primary production; secondary recovery of purchased scrap |
| Fluorspar | Unknown | Very little |
| gallium | Unknown | No old scrap, significant new scrap recovered |
| germanium | NA | About 30% worldwide |
| Graphite | Unknown | Not much because of raw material abundance |
| Hafnium | negligible | |
| Helium | NA | Very little |
| indium | Significant domestic recycling but amount not known |
On a global scale, secondary production greater than primary production |
| Lithium | Very little | DOE grant was awarded in 2009 for a recycling facility. A US recycling facility for lithium-ion vehicle batteries opened in 2015. |
| Magnesium metal | 120,000 tones | Old and new scrap |
| Manganese | negligible | |
| Niobium | none reported | May be as high as 20% according to USGS. |
| Platinum | Known for platinum only |
120,000 kilograms of platinum group metals recovered globally from old and new scrap |
| Potash | none | |
| REEs | Very little | |
| rhenium | Some | |
| Rubidium | none | |
| scandium | none | |
| Strontium | none | |
| Tantalum | New scrap recovered but amount unknown |
May be as much as 10% according to USGS. |
| Tellurium | Very little | |
| Tin | 25% | 12,300 tons, mostly old scrap |
| Titanium | 69,600 tons scrap metal | |
| Tungsten | NA | Old and new scrap |
| Uranium | NA | |
| vanadium | NA | Significant amount from spent chemical process catalysts |
| Zirconium | Some |
Source: USGS Mineral Resources Summaries, 2019.
Notes: NA = not available. Unknown = no data reported by the USGS. The table uses the 2017 data from the USGS Mineral Commodity Summaries report, 2019, because the summaries provide USGS 2019 actual data for 2017 and only estimated data for 2018.
Reserves and resources
A distinction is made between what is described when using the terms reserves and resources related to minerals. Reserves are amounts of mineral resources that are expected to be recovered from known deposits at a certain point in time. All estimates of reserves are subject to a degree of uncertainty. Proven reserves are the quantities of minerals that can be obtained with reasonable assurance from known deposits economically under current economic conditions, operating methods and governmental regulations. The current economic conditions include the prices and costs valid at the time of the estimate. Estimates of proven reserves do not include an appreciation of reserves.
Resources are concentrations in the earth's crust of naturally occurring minerals that may be discovered and recovered. Undiscovered, technically exploitable resources are minerals that can be extracted as a result of natural resources or other secondary exploitation methods, but without regard to economic viability. They are predominantly located outside known deposits.
Critical Mineral Reserves and Resources of the USA
In terms of reserves, the USGS has few to no reserves in all 35 critical minerals, with the exception of helium and beryllium and significant resource potential only in tungsten, lithium, vanadium, uranium, and rare earths. Of the 14 critical minerals listed as 100% import dependent, the USGS lists some reserves for two: REEs and vanadium (see 4 table and Figure 2).
Regarding resources, USGS identifies some resource potential for cesium, manganese and niobium. There are by-product resources of cobalt, germanium, tellurium and rhenium associated with major products such as copper, zinc and bauxite (see table 4). The USGS is uncertain about the US and global reserves of several critical minerals because there is not enough data available after the USGS.60.
Global Critical Mineral Reserves and Resources
According to USGS, there is a significant or abundant resource potential at the global level for the critical minerals for which the agency has data, some but not all of the critical minerals. The global resource potential for bismuth, cesium, germanium, indium and tellurium is either unknown or uncertain. The majority of germanium, indium and tellurium are obtained as a by-product in the production of base metals.
China is the world leader in seven critical minerals, including antimony, REEs, strontium, tellurium, tin, tungsten and vanadium (see table 4). China is one of the three leading reserve hubs for barite, fluorspar, graphite, magnesium compounds and titanium.
Table 4 contains available information about the global resources of critical minerals as well as information about the size of the reserves. Figure 2 shows the regional distribution of reserves.
Table 4. Critical Minerals: Global Resources and Reserves, 2017
(In tonnes, unless otherwise stated)
| Mineral | Resources | reservations | Leading Reserve Holders by Country |
Comments |
| Aluminum (Bauxite) |
Abundant global resources; US resources not significant | 30 b mt | Guinea (24.6%), Australia (20.6%), Vietnam (12.3%), Brazil (8.6%), Jamaica (6.6%) | China has 3% of reserves but produces almost 23% of bauxite. |
| Antimony | Some resource potential in Alaska, Montana and Idaho. Principal global resources in Australia, Bolivia, China and Mexico | 1.5 b mt | China (32%), Russia (23%), Bolivia (21%) | The United States has about 4% of global reserves |
| Arsenic | Unknown | NA | NA | No US reserves; world reserves unavailable but estimated at about 20x current global production. |
| Barite | 2 billion tons worldwide; significant US resources | 320 mt | Kazakhstan (26.5%), India (16%), China (11%), Turkey (11%), Others (35.5%) | No US reserves |
| beryllium | 60% of world's estimated 100,000 mt of resources in the US | NA | NA | |
| Bismuth | NA | NA | NA | No US reserves |
| cesium | Some US resource potential, world resources unknown | 90,000 mt | Zimbabwe (67%), Namibia (33%) |
No US reserves |
| Chromium | Small US resources
Significant world resources |
560 mt | Kazakhstan (41%), South Africa (35.7%), India (17.8%), Others (5.5%) |
|
| Cobalt | Small US resources
25 m terrestrial; 120 with seabed nodules |
6.9 b mt | DRC (49%), Australia (17.4%), Cuba (7.2%), Others (26.4%) | |
| Fluorspar | 500 million tons worldwide; Significant resources in phosphate rock in the United States | 310 mt | Mexico (21.9%), China (13.5%), South Africa (13.2%), Others (51.4%) | No stand-alone US reserves, but significant amounts contained in phosphate rock |
| gallium | Significant resources worldwide in bauxite and zinc but only 10% recovered; sub-economic resources in the US contained in bauxite | NA | Unknown | |
| germanium | Uncertain | NA | Unknown | |
| Graphite | > 800 m mt inferred resources. Small US resources | 300 mt | Turkey (30%), China (24.3%), Brazil (24%), Others (21.7%) | |
| Hafnium | NA | NA | NA | |
| Helium | 20,600 million cubic meters in the United States | NA | US, Algeria, Russia | US is a world leader in reserves with 3,900 million cubic meters |
| indium | NA | NA | NA | NA |
| Lithium | 47 m globally;
6.9 m in the United States |
14 mt | Chile (57%), Australia (19.3%), Argentina (14.3%) China (7%), Others (2.4%) | Small US reserves but significant resources |
| Magnesium compounds | Billions of tons worldwide | 8.5 b mt | Russia (27%), North Korea (27%), China (11.8%), Others (34.2%) | |
| Manganese | Low grade resources in the United States;
78% of global resources in South Africa |
760 mt | South Africa (30.2%), Ukraine (18.4%), Brazil (14.5%), Australia (13%), Others (23.9%) | |
| Niobium | Resources more than adequate supply to meet global demand;
Low grade resources in the US |
9.1 mt | Brazil (80%), Canada (17.6%), Others (2.4%) | |
| Platinum Group Metals | 100 million kilograms | 69,000 mt | South Africa (91%) | Some US reserves. Most of the world's resources are in South Africa |
| Potash | 7 billion tons in the United States, 250 b mt worldwide | NA | Canada, Belarus, Russia | USGS did not report total world reserves |
| Rare Earth Elements | Abundant but not always in minimum concentrations; significant resources in the United States | 120 mt | China (37%), Brazil (18%), Russia (15%), India (5.8%), Australia (2.8%) | Some US reserves |
| rhenium | Significant US and world resources | 2,400 mt | Chile (54%), United States (16.6%), Russia (12.9%), Others (16.5%) | |
| Rubidium | Significant world resources | 90,000 mt | Namibia (55%), Zimbabwe (33%), Others (12%) |
|
| scandium | Abundant world resources | Unknown | ||
| Strontium | About 1 billion tons | 6.8 b mt | China (percent of total unknown) | USGS did not report reserve data for other countries |
| Tantalum | Some resources in the US | > 110,000 mt | Australia (70%), Brazil (30%) | Data unavailable for other countries, even though 80% of production is in Africa |
| Tellurium | NA | 31,000 mt | China (21.3%), United States (11.3%), Others (67.4%) | Some US reserves contained in copper and lead ores |
| Tin | Abundant worldwide; some resources in the US, mostly in Alaska | 4.7 mt | China (23.4%), Indonesia 17%), Brazil (15%), Others (44.6%) | No US reserves reported |
| Titanium | 2 billion mt of titanium mineral concentrate worldwide | 880 mt | Australia (28.4%), China (26.1%), India 9.7%), Others (35.8%) | Data in this row does not include rutile (a related mineral). Small amount of US reserves |
| Tungsten | Abundant global resources; The United States has significant tungsten resources | 3.2 mt | China (57.5%), Others (42.5%) | |
| Uranium | 7,641,600 tons worldwide | 4.4 mt | Australia (26%), Canada (11%) Kazakhstan (8.2%), Niger (7.2%), Namibia (6.8%), Russia (6.2%) | |
| vanadium | 63 million tons worldwide; significant resources in the United States | 20 mt | China (47.5%), Russia (25%), South Africa (17.5%), Others (10%) | Small US reserves |
| Zirconium | Substantial zirconium resources as part of titanium and phosphate rock | 73 mt | Australia (57.5%), South Africa (19%), Others (23.5%) |
Source: USGS, Mineral Commodity Summaries, 2019. Data on uranium from the Energy Information Administration, 2018 Domestic Uranium Production Report, May 2019.
Notes: mt = tons; m mt = million tons; kg = kilograms; b mt = billions of tons; NA = not available.
Figure 2. Critical Minerals: Global Reserves (2017)
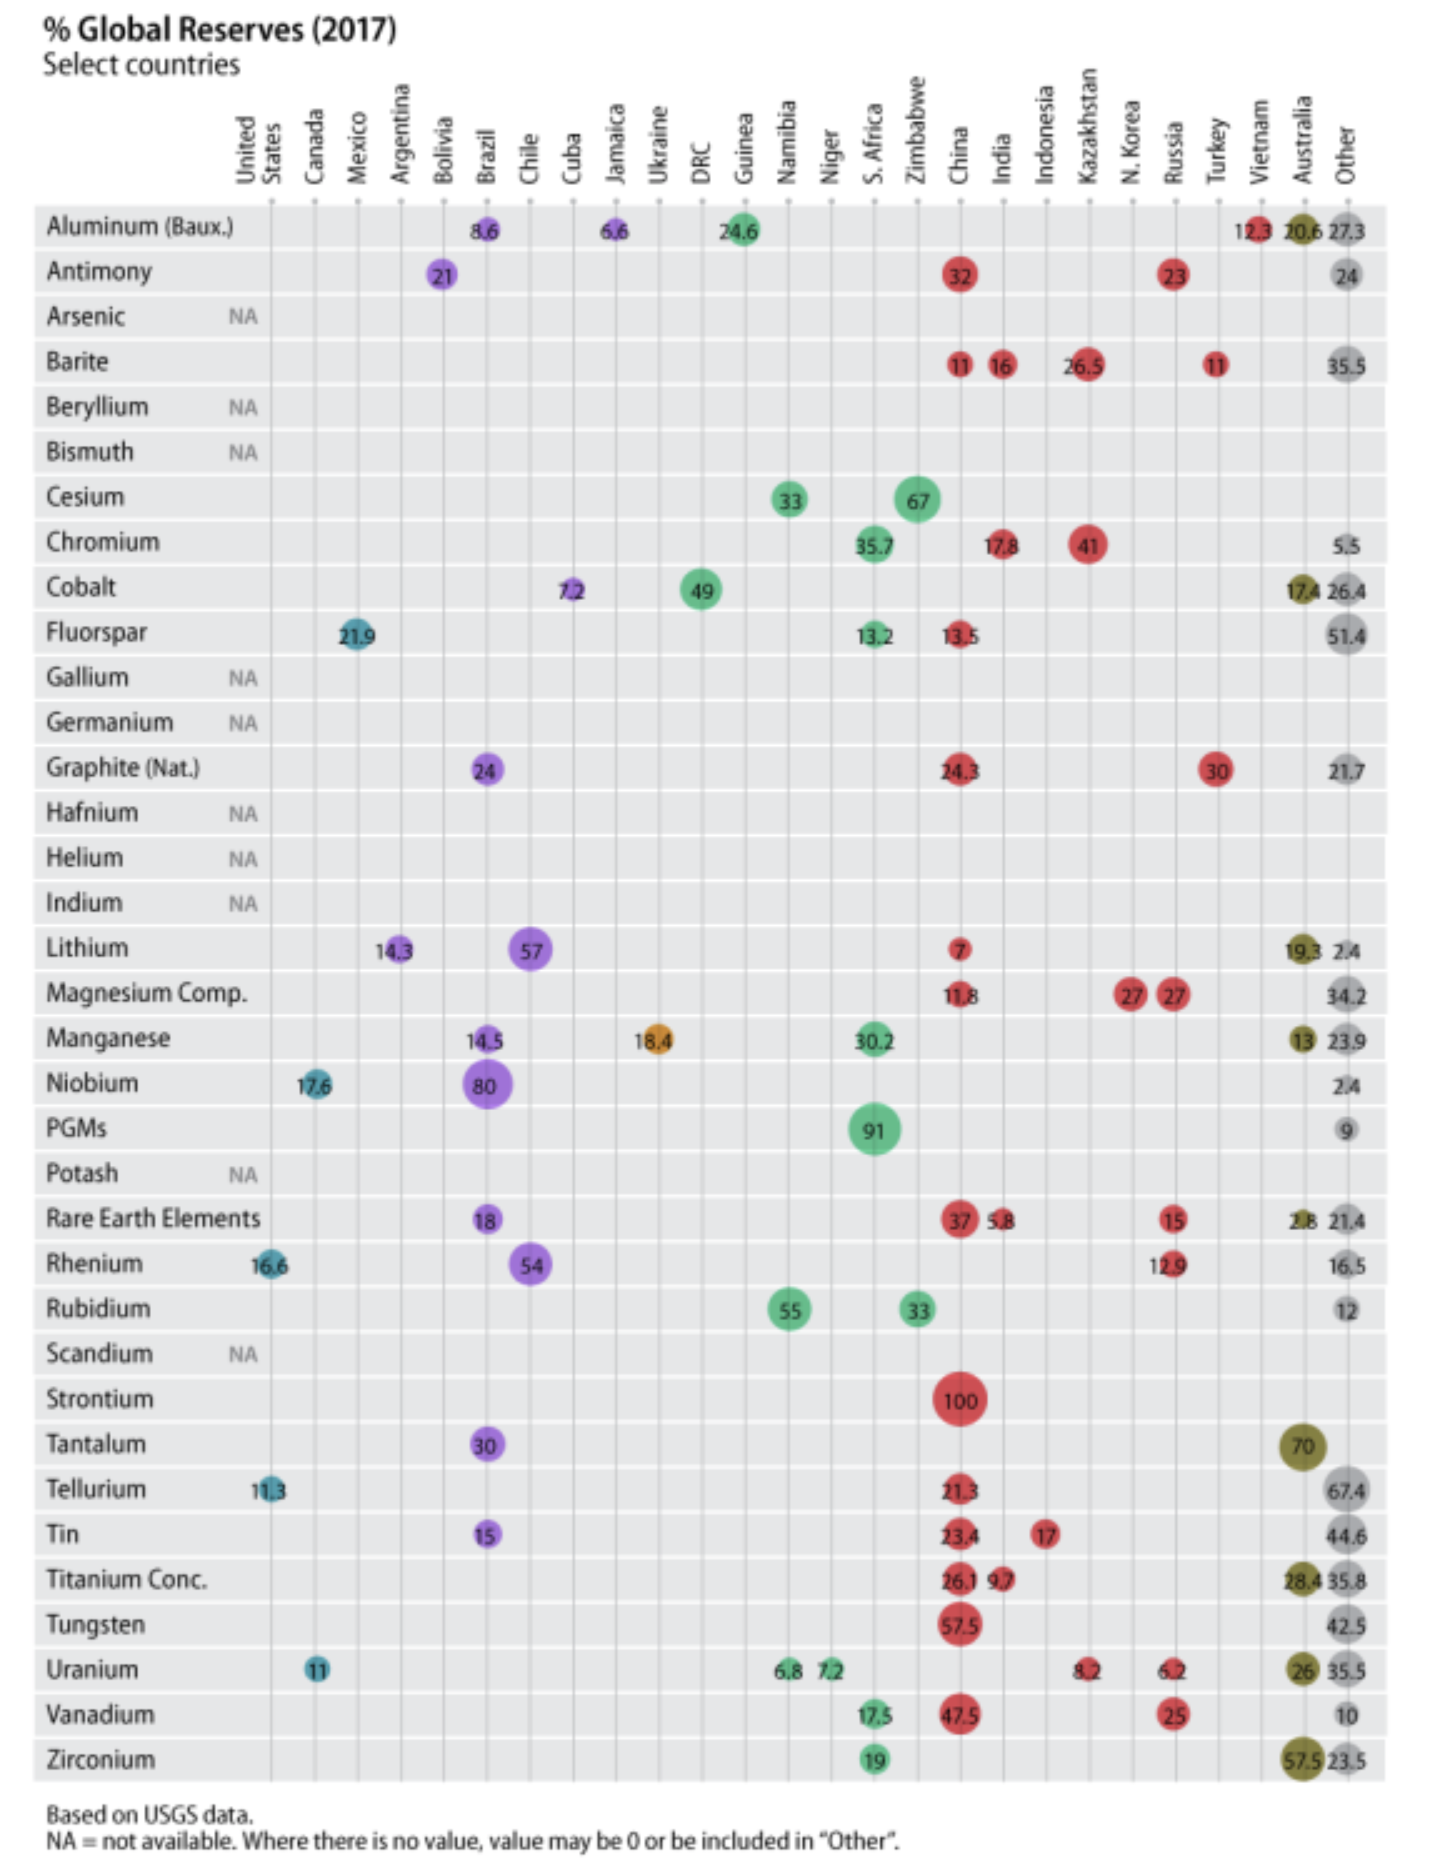
Source: Figure created by CRS based on USGS data, Mineral Commodity Summaries, 2019.
Note: Color codes: Blue = North America; Purple = South America; Orange = Europe; Green = Africa; Red = Asia and Russia; Dark green = Australia; and gray = other countries that are not explicitly mentioned in the previous columns. USGS reports strontium reserve data only for China.
minerals exploration
Mineral exploration expenditures in the United States have increased since 2001. The United States has maintained between 1997 and 2017 approximately 8% of the annual mineral exploration budget worldwide. In 2017, this spending in the United States was at 225 exploration sites (from 2.317 exploration sites worldwide); 41% of US sites were in Nevada, 14% in Alaska, and 11% in Arizona. It can take many years for a mining company to find and commercialize an economic deposit. Therefore, it is important for industry to hold mineral projects in the exploration development process.
In general, mineral exploration in the United States continues to focus on a few minerals, most of which are not considered critical. The exploration activities in the western states mainly cover gold, copper, molybdenum, silver, tungsten and uranium. There had been some interest in developing quartz sand activities in Nevada, in developing a copper-cobalt-gold project in Idaho on Forest Service Land, and in producing thorium on federal land along the Idaho-Montana border.
Canada is the world leader in the most active exploration locations, mainly for gold and base metals (through 500 locations), followed by Australia (through 500 locations) with investments mainly in gold, base metals and uranium.
Locations and minerals in exploration
The sites and minerals under investigation can determine how critical the mineral supply chains are or can develop. These supply chains are relevant to various policy issues, including what is the long-term investment strategy in the United States to develop mineral extraction and downstream metal and manufacturing capabilities; and, if the focus is on building a reliable supply chain, which part of that supply chain makes sense to develop in the United States?
There have recently been new additions to the annual USGS mineral exploration trial. Data on lithium, niobium, rare earths and tungsten are now included. Since 2014, data has been collected for other minerals such as scandium, vanadium and yttrium.
The great global research history is about lithium. In 2016, global exploration costs for lithium, cobalt and gold increased significantly. Spending on lithium exploration has quadrupled since 2015, and active exploration sites increased from 56 in 2012 to 167 sites in 2017. For example, 22's lithium exploration expenditures increased from 2015 to 128 millions of dollars in 2017 as 23's lithium exploration companies increased from 2015 in 125 to 2017 in 2007 year. The price of lithium increased from 2016 to 150 by more than 83% and is 10% above the 2016 annual average. The number of cobalt grades has increased by 121% since XNUMX.
In the United States, Gold 2017 remains at the top of the list of exploration locations (47%), followed by copper (12%) and then lithium with 7% of locations. USGS noted that there continues to be interest in graphite, REEs and tungsten in the United States, but the most notable locations are in gold exploration. A total of 54% of actively explored locations in the United States are for gold and silver and 22% for base metals. Gold or silver worldwide make up 84% of the actively explored locations.
The USGS reported that in the last 10 years, the United States accounted for about 7% to 8% of the total global exploration budget (about 611 million dollars a year 2017). However, the annual review is not exactly a country comparison as the USGS uses regions such as Latin America and Africa for comparison with individual countries such as Canada, Australia and the US. The US Mineral Resources Exploration budget is higher than that of China (5%), Russia (4%) and many Latin American countries.
Latin America attracts the most exploration dollars at $ 2,4 billion, most of it for gold and silver (58%), followed by base metals at 22% of exploration spending. Chile has made the most investments in Latin America, followed by Peru. Latin America is home to 70% of the world's known lithium deposits, known as the "Lithium Triangle", consisting of Chile, Argentina and Bolivia. In Argentina, lithium exploration sites account for 44% of exploration spending, followed by gold / silver at 42% and copper at 9%. Lithium is the most developed in Chile as it has excellent mining infrastructure. Most of the exploration projects in Chile involve copper (49%) and gold (29%).
In Australia, too, lithium exploration has improved. China invested 2016 650 millions of dollars (in US dollars) in Australia and was looking for lithium and gold, especially. As ore grades decline at known reserve locations, many exploration companies are looking for high-grade deposits in remote areas, including the seafloor.
Demand: Critical Mineral Use and US Import Dependency
Demand for critical minerals
Demand for mineral resources is a derived demand that differs from consumer demand. Minerals are used as input for the production of goods and services. For example, the demand for rare earth elements results from the manufacture of their end products or their use, such as flat screens, automobiles or catalysts. As a result, the demand for critical minerals depends on the strength of demand for the end products for which they are input. An increase in demand for the final product will lead to an increase in the demand for critical minerals (or their substitutes).
In terms of derived demand, the extent to which the amount of a material decreases, with increasing mineral and metal prices, largely depends on the extent to which its price increase can be passed on to the final consumer and the share of the mineral / metal raw material in the end product price. That is, it may depend on the amount of critical mineral or metal used per unit of production. The most important variables that determine the growth of consumer demand are price and income growth.
US and global demand
Demand in the US has fallen for some critical minerals, for others demand has risen but not as strong (in relative terms) as global supply growth. For example, during the past 20 years, consumption has decreased for aluminum, chromium, manganese, platinum group metals, rare earths, titanium and tantalum, and demand for lithium, germanium and graphite has been rising slowly. Only for tellurium, niobium and indium did the United States register a rapid increase in demand (relative to supply). Demand drivers for critical minerals in recent decades include permanent magnets with REEs, batteries with cobalt and lithium, cars and electronics with tantalum and niobium, and vanadium for steelmaking.
Global demand data for each of the critical minerals was not available at the time of writing. Global demand data could provide more insight into where the minerals are used for metal alloy, the manufacture of individual parts and end products. Embodied metals (those imported as end products) are not counted as demand.
Many critical minerals (eg manganese, tungsten and vanadium) are used for steel construction and infrastructure projects such as roads, housing, railways and power grids. Others (eg REEs, lithium, indium, tantalum, gallium and germanium) are used in the production of high quality electronic products such as laptops and batteries, renewable energy systems and other consumer goods such as cars and appliances (see table 5).
Demand for critical minerals in China
In China, the demand for critical minerals has risen sharply. China's demand for natural resources has risen to historic levels and could continue to rise in the long run, even as the economy slows. In the recent past, China was the fastest growing market for niobium, contributing 2010 25% to global niobium consumption. Manganese consumption increased from around 2.200 tonnes (million tonnes) in 2003 to around 9.000 tonnes in 2008 year. China's demand for vanadium was in line with steel demand, rising from 2003 to 2009 by 13% annually. In general, demand for vanadium in China from 2010 to 2025 is expected to double as it continues to be used in steelmaking (including new steel hardening requirements) and because it can be used in new battery technologies for large-scale storage of renewable energy (eg, vanadium). Redux flow battery-VRFB). 2010 accounted for 85% of China's demand for chrome ore imports and is the world's leading steel producer (which, according to the latest 2017 data, accounts for more than half of world production). Chromium is an important production component for stainless steel. China's chrome imports are likely to continue to rise as demand for stainless steel at the global level remains a large part of high-quality Chinese exports, urbanization and future industrial practices.
Overall, China's cobalt smelting accounted for 2017 60% of the global supply and 77% of cobalt demand in China went into batteries. 2017 accounted for about 25% of China's platinum demand, which is mainly used in jewelry manufacturing, and 26% of palladium demand, much of which is used in catalytic converters in automobiles.
In order for this growing demand scenario in China to pay off, cities would have to get enough people earning high wages to support China's economic growth aspirations. It is uncertain whether such a high level of consumer demand will materialize. China's economic growth has slowed significantly in the recent past, from about 10% annually in the first decade of the 2000 years to about 6% in the year 2014. However, China's demand for minerals will continue to put pressure on US access to reliable sources of supply.
US imports of strategic and critical minerals
Apart from a small amount of recycling, the United States is 100% dependent on import of 14 minerals on the list of critical minerals, minerals that constitute critical support to the US economy and national security, such as graphite, manganese, niobium, rare Earths and Tantalum, among others. The United States relies more than 75% on additional 10 critical minerals, including antimony, barite, bauxite, bismuth, potash, rhenium, tellurium, tin, titanium, and uranium.
The United States has increased its mineral imports from China in the last 20 years. Although the United States has diversified its sources of some of its material needs since 1997, the United States imports significant quantities of critical minerals and metals and, starting from 2017, either depends on China as the main or main supplier of raw materials and several metals (see table 5 and Figure 3).
While import dependency can be a cause for concern (and a high level of import dependency, possibly a security risk), high import dependency is not necessarily the best measure or even a good measure of supply risk. A more relevant measure can be the reliability of the suppliers. In the case of potash or bauxite, for example, the supply risk can differ from that of REEs or niobium due to the large number of possible sources. There are a number of factors that affect the availability of minerals that may have little to do with import dependency. A company that is the sole supplier or a single country as the main source with export restrictions would likely pose a supply risk. But also a large number of bottlenecks that can occur at domestic and foreign producers, such as limited amounts of electricity, shortage of skilled workers, lack of equipment, labor unrest, weather or transport delays as well as resistance for environmental reasons, could represent supply risks. Any of the above potential supply disruptions could increase costs or prices and exacerbate supply shortages. For other minerals, such as iron ore and molybdenum, the United States is self-sufficient. For aluminum, uranium, potash, cesium and rubidium, Canada is the United States’s main trading partner, a stable ally. In addition, US companies have invested in overseas operations - copper and bauxite mines, for example - so US sources of supply for some materials are diversified, better quality or cheaper, and are located in countries with extensive reserves and production capacities. Such conditions may not always exist in the United States, even when resources are available.
Table 5. Critical Minerals: Major end uses and US net import dependency
| Mineral | Major End Uses |
Import Reliance (%) |
Major Sources |
Comments |
| Aluminum (Bauxite) |
transportation, packaging, building, electrical | > 75 | Jamaica (46%), Brazil (25%), Guinea (15%), Other (14%) | The data reflect the import reliance for bauxite, the source mineral for aluminum |
| Antimony | ceramics, glass, and rubber products, fire retardant | 85 | China (61%), Other (39%) | Major sources are for antimony oxides |
| Arsenic | lead storage batteries, herbicides, insecticides, military applications | 100 | China (91%) | Import of arsenic metal |
| Barite | filler, extender, and weighing agent in paint, plastics and rubber | 86 | China (63%), India (14%), Others (23%) | |
| beryllium | auto and consumer electronics, defense applications | 17 | Kazakhstan (44%), Japan (14%), Others (42%) | |
| Bismuth | Additives for lead-free pipe fittings | 97 | China (80%), Others (20%) | |
| cesium | photoelectric cells and energy conversion devices | 100 | Canada | According to USGS, Most imports are from Canada, but from Canada is unavailable |
| Chromium | transportation, packaging, building, electrical | 71 | South Africa (97%) | Import reliance for chromite ore |
| Cobalt | super alloys, aircraft engines, batteries, permanent magnets | 69 | Norway (18%), China (12%), Japan (12%), Others (58%) | These imports reflect cobalt contained in metal, oxides and salts |
| Fluorspar | used in processing aluminum, and uranium | 100 | Mexico (69%), Vietnam (10%), South Africa (8%), Other (13%) | |
| gallium | integrated circuits (in high-tech equipment), light emitting diodes (LEDs), solar cells | 100 | China (32%), UK (28%), Germany (15%), Ukraine (14%), Other (11%) | |
| germanium | fiber optics, infrared optics, solar cells, other solar energy applications | > 50 | China (58%), Belgium (26%), Other (14%) | Import reliance for germanium metal |
| Graphite (Natural) | steelmaking, refractory applications, foundry operations, brake linings | 100 | China (37%), Mexico (29%), Canada (17%), Other (17%) | |
| Hafnium | super alloys | NA | Germany, France, UK | Percentage from each country unavailable |
| Helium | Lifting gas, lab applications, MRI, welding | — | United States is a net exporter | |
| indium | electrical conduction, liquid crystal displays (LCDs), solar cells and photovoltaics | 100 | China (27%), Canada (22%), Other (51%) | |
| Lithium | rechargeable batteries, ceramics, glass, chemical compounds | > 50 | Argentina (51%), Chile (44%), Others (4%) | |
| MagnesiumCompounds | Agriculture, chemicals, construction, and industrial applications | 51 | China (57%), Canada (22%), Others (21%) | |
| Manganese | production of steel and other metals | 100 | Gabon (74%), South Africa (13%), Australia (8%), Others (5%) | |
| Niobium | steel and super alloys | 100 | Brazil (72%), Canada (18%), Others (10%) | Imports of niobium include ore and concentrate, niobium oxides, ferroniobium, and niobium metal |
| Platinum Group Metals | car catalysts, fuel cells, jewelry | 71 | South Africa (44%), Germany (15%), UK (10%). Others (31%) | This row represents platinum only. The United States is 38% import reliant on palladium most of which comes from Russia and South Africa |
| Potash | fertilizer, chemical industry applications | 92 | Canada (84%) | |
| Rare Earth Elements | permanent magnets, petroleum refining, glass, lasers, steel alloys, fluorescent lighting | 100 | China (80%) | |
| rhenium | super alloys in high temperature turbine engine components and petroleum reforming catalysts | 81 | Kazakhstan (34%), Canada (19%), South Korea (13%), Germany (10%), Others (24%) | |
| Rubidium | biomedical research, electronics, specialty glass | 100 | Canada | Percentage from Canada unavailable |
| scandium | Ceramics, electronics, lasers, radioactive isotopes, lighting | 100 | Mostly from China, Europe, Japan, and Russia | Percentage from each country unavailable |
| Strontium | additive in drilling fluid for oil and gas wells | 100 | Mexico (52%), Germany (39%), Others (9%) |
|
| Tantalum | capacitors for electronic devices | 100 | Brazil (35%), Rwanda (31%), Australia (15%), Others (19%) |
|
| Tellurium | photovoltaic panels, solar cells, thermoelectric devices | > 75 | Canada (66%), China (27%), Others (7%) |
|
| Tin | Chemicals, tinplate, solder and alloys | 76 | Indonesia (23%), Malaysia (23%), Peru (22%), Bolivia (17%), Others (15%) | |
| Titanium Concentratee | aerospace applications | 92 | South Africa (35%), Australia (27%), Canada (12%), Mozambique (11%), Others (15%) |
|
| Tungsten | cutting tools, wear-resistant materials used in construction and metal making | > 50 | China (32%), Germany (9%), Bolivia (9%), Canada (8%), Others (42%) |
|
| Uranium | fuel for nuclear reactors | 93% | Canada, Australia, Russia | 7% of the uranium purchased by US power plants in 2017. |
| vanadium | steelmaking, aerospace applications | 100 | South Africa (46%), Russia (18%), Brazil (13%), China (10%), Others (13%) |
|
| Zirconium | Used in ceramics, foundry sand, refractories, and abrasive | — | South Africa (59%), Australia (22%), Senegal (14%) |
The United States is a net exporter |
Source: USGS, Mineral Commodity Summaries, 2019.
Note:> = greater than.
Figure 3. Critical Minerals: US Net Import Dependence (2017)
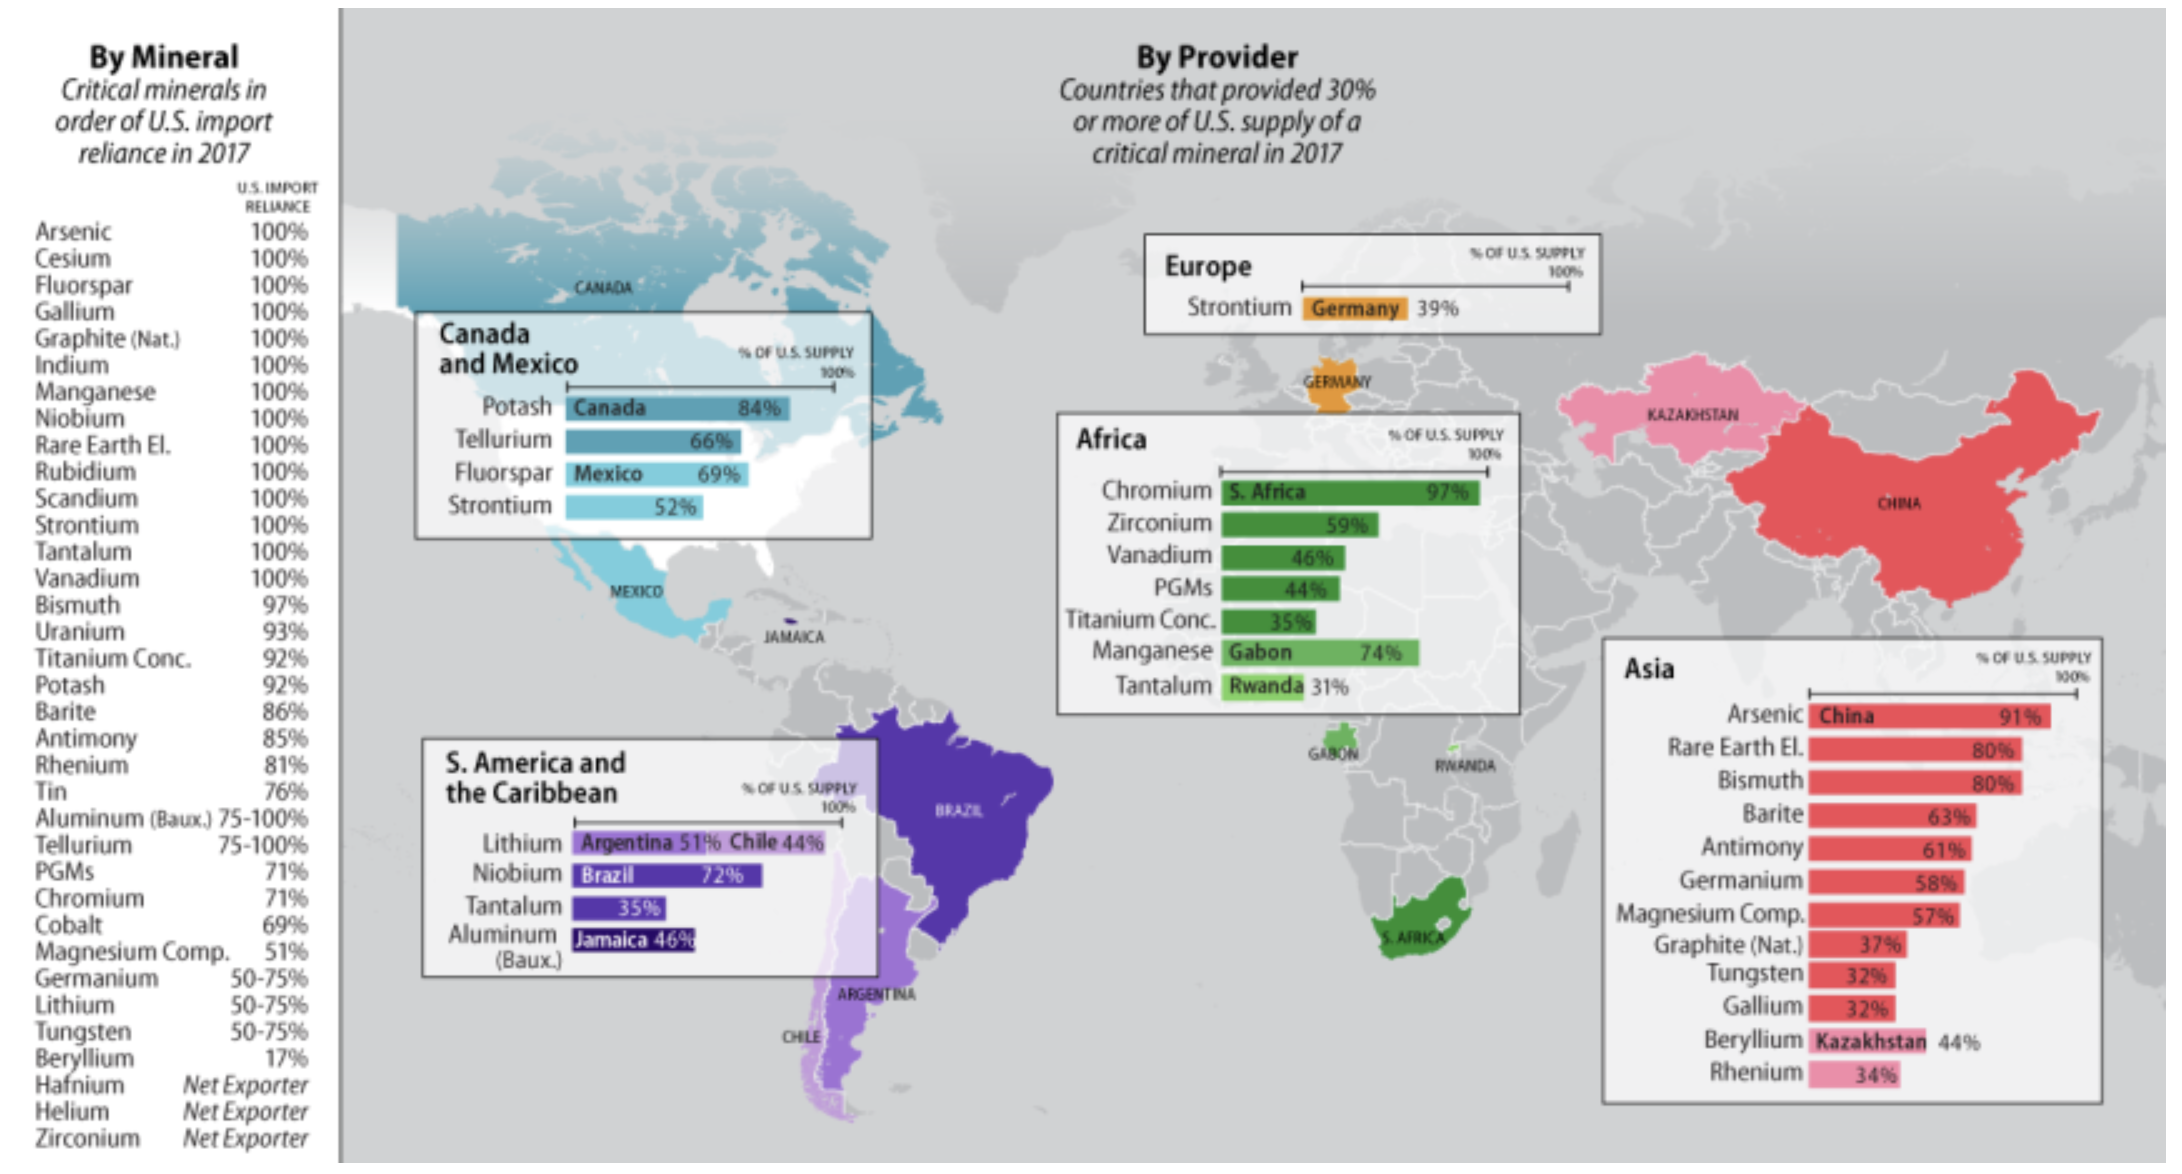
CRS generated illustration based on the USGS Minerals Commodities Summaries data, 2019. Note: The countries listed in the bar chart represent the leading supplier of US imports.
Material analysis of critical mineral contents in finished products and systems
Material analysis is a useful tool to better understand different aspects of mineral needs. For example, such an analysis can shed light on how material inputs are used in components and how components are used in larger systems such as solar panels, wind turbines, and automobiles. Using material analysis, an analyst can get information about the material intensity of a production unit. This analysis can result in production efficiencies (ie, achieve the same or better performance with fewer materials) or show where and how material substitution could occur, if possible. Manufacturing companies could then make short- or long-term adjustments to their production processes.
Even material efficiency, which consumes less metal per unit of output, is generally driven by general demand growth and the lack of supply capacity in the short term. For example, households in some countries are likely to have multiple units with a variety of products, such as laptops, flat screen televisions and cell phones, and so on. And because the material intensity (small amounts per unit of production) of critical minerals is relatively low for most end uses, inexpensive finished products may contain some costly materials.
The rest of this section of the report provides information on the material content of lithium-ion batteries, solar systems, wind technologies, and permanent magnets, as well as material requirements for wind and solar systems.
Lithium-ion batteries
The use of lithium-ion batteries for the rapidly growing electric vehicle market is expected to change the material requirements for battery technology. Material analysis of lithium-ion batteries would provide useful insights into material composition, costs, technologies, and supply chains. In the case of the lithium-ion battery for electric vehicles, what is the material composition of the battery? In other words, how much cobalt, lithium, nickel, and other materials are needed per battery, what is the cost of materials for each battery, and what is the percentage of the total battery manufacturing cost that the materials account for? Then, what are the battery costs per electric vehicle? Analysts would want to know at what point material price increases would justify postponing the use of these materials. Other useful insights in material analysis would include understanding the range of battery technologies to be developed, their manufacturing capacity, and the ownership structure of the materials and batteries supply chain.
A study by a group of battery technology researchers from 2017 investigated the supply risks of lithium-ion batteries and other battery technologies to investigate the impact on a CO2-reduced environment. The authors asked the question: What are the material requirements for the battery? They identified features of a Li-ion battery, such as low cost, high energy and long life. They investigated the demand for Li-ion batteries, the secondary supply potential and the supply risks associated with a depletable resource (eg, mineral extraction may become uneconomic), the structure of the industry (eg whether a cartel or a monopoly producer is involved) and an increase in demand. They used the previously discussed offer risk indicators such as the risk of supply reduction, the risk of an increase in demand, market concentration, political stability, substitutability and recyclability.
In the second step, the researchers determined the supply risk value at the technological level for each of the six battery types. There is a lithium cobalt oxide battery that has a high energy density, but also a high cobalt content and price. The high country risk of cobalt production in the Democratic Republic of the Congo (DRC) prompted researchers to look for alternative suppliers and materials that offer high energy density and long life with little or no cobalt. An example would be the use of a manganese oxide battery in which cobalt is partially replaced by nickel and manganese. They pointed out that there are several new battery types that use combinations of lithium, aluminum, cobalt, iron, nickel, copper, graphite, phosphate, titanium and manganese. The researchers identified lithium as necessary for all battery types and graphite for all except the lithium-iron-phosphate type (LFP-LTO), which uses titanium instead. They reported that a market breakthrough (to 2035) in the use of electric vehicles using lithium battery technology requires an annual growth rate of 7,5% for the lithium supply and 3% for the cobalt supply to meet the demand for electric vehicles.
Solar energy systems and wind technologies
In the case of solar panels and wind turbine technologies, the USGS Minerals Information Center conducted a technical analysis of the by-product minerals contained in solar energy systems: silver, cadmium, tellurium, indium, gallium, selenium, germanium and four of the REEs used in wind technologies (Dyprosium (Dy ), Neodymium (Nd), terbium (Te) and praseodymium (Pr)), using the Clean Power Plan (CPP) and the non-CPP scenarios. USGS concluded that, regardless of the scenario, the transition to renewables is likely to accelerate in the coming decades, and that a number of smaller metals are likely to be curtailed; therefore, the production rates of these metals would have to be increased to meet demand, unless there are production relocations. The analysis concluded that the supply of heavy rare earths used in permanent magnets (which are currently used in some of the new wind turbines) will not keep pace with demand from multiple end-uses. The USGS adopted an aggressive market for electric vehicles, the increased use of magnets in electric vehicles and the use of rare earth permanent magnets by new wind turbines. There is some disagreement over whether there will be a significant increase in rare earths for magnets used in wind turbines.
In addition, USGS concluded that the growing demand for by-product metal in solar and wind turbines would compete with use in electric and hybrid vehicles as well as in consumer electronics. The report notes that a material uncertainty is the net material intensity, ie the amount of by-product metal needed per unit of installed power generation capacity, minus the amount of recycled material. For solar cells, the net material intensity per generation capacity depends on the conversion efficiency of the solar cells.
Related questions include: Where are the wind turbines and solar panels manufactured, and which countries and companies would be most affected by a disruption of critical mineral supplies for these end uses?
Permanent Magnets
Permanent magnet REEs are another example of how material analysis for end use can affect the understanding of the susceptibility of critical minerals. For example, some of the relevant questions that could be posed regarding permanent magnets are: How much Dy, Nd, Te, and Pr flow into a neodymium-iron-boron (NdFeB) permanent magnet, and what percentage of the total cost is spent on each element ? What are the production costs for permanent magnet units and what percentage of the total costs of a wind turbine or a car are the permanent magnets? And what is the probability and the economy of substitution?
Material testing of wind and solar energy systems
Below are simplified examples of material requirements for wind and solar systems.
Materials for wind energy
Based on the energy report of the Ministry of Energy, 20% wind energy up to 2030, wind turbines consist of four main parts: wind tower, rotor, electrics and powertrain (eg generator, gearbox and engine). Most of the popular large wind turbines have turntables above 200 feet and rotor blades up to a length of 150 feet. The average rated power of an onshore wind turbine is between 2,5 megawatts (MW) and 3 MW. DOE lists the most important materials for large-scale production of wind turbines: steel, glass fiber, resins (for composites and adhesives), core materials, permanent magnets and copper. In addition, some aluminum and concrete is needed (see table 6 below). DOE believes that the raw materials for large wind turbines are generally abundant. Turbine production, however, would be dependent on 100% of permanent imports, especially from China, as it produces 75% of the world's permanent magnets containing REEs (assuming certain powertrains are used). But DOE and other wind energy analysts also identify as a potential issue the need for increased production capacity for fiber and other components such as generators and transmissions. The development of wind energy at the time of the 20% study Wind Energy to 2030 has moved towards lighter materials and high-strength composites such as glass fiber reinforced plastics and carbon fiber reinforced plastics. Increased production of fiberglass, commercial carbon fiber and permanent magnets (with REEs) would be necessary if the United States achieved up to 2030 20% wind energy.
Recent analyzes show that the offshore wind industry could be a major driver of REE demand growth. There are indications that the larger turbines, which are more suitable for offshore locations and contain REEs, could be more reliable and require less maintenance than onshore turbines.
Table 6. Selected materials for wind energy
| Turbine materials | US Supply | Comments |
| Permanent magnet | No US production, little supply from secondary recovery | China produces nearly 75% of the world's permanent magnets. Significant production increases needed for future wind power needs. |
| Concrete | US production | |
| Steel | US production | |
| Aluminum | US production (50% import reliant) | |
| Copper | US production | |
| Glass fiber-reinforced plastic | US production of fiberglass | |
| Carbon fiber-reinforced plastic | US production | Globally, carbon fiber production is about 50 million lbs. per year. Significant production increases needed for future wind power needs. |
| Adhesives (petrochemical based) | US production | |
| Core (petrochemical based) | US production | |
| Battery technology containing the following materials | ||
| Sodium sulfur | US production | |
| Zinc-bromide | US production | |
| Vanadium redox | No US production or reserves of vanadium | |
| Lithium-ion | Some US production of lithium carbonate, small reserves | |
| Polysulfide bromide | US production |
Source: US DOE, 20% Wind Energy By 2030 (2009) and Xcel 2007 Resource Plan, “Appendix E. Wind Storage Research and Experiments.” Wilburn DR, Wind Energy in the United States and Materials Required for Land-Based Wind Energy Industry 2010-2030. Scientific Research Report 2011-5036.
Notes: Critical minerals that could be used in the manufacture of wind turbines include the rare earth elements used in permanent magnets, vanadium and lithium for battery technology, and aluminum. These are printed in bold in the table.
Raw materials for solar energy
There are two main types of photovoltaic (PV) cells: crystalline silicon cells (most widespread) and thin-film solar cells. The silicon-based PV cells are combined into modules (with about 40 cells) and then mounted in an array of approximately 10 modules. Ethylene vinyl acetate and glass panels typically frame the PV module with additional aluminum frames for added protection. Thin-film solar cells use layers of ultra-thin semiconductor materials that can be used directly in shingles, roof tiles, and building facades. It has been found that thin film solar cells use cadmium telluride or copper indium gallium diselenide (see table 7 below). A separate category of solar technology is the concentration of solar energy; These systems use mirrors to convert solar energy into heat and then into electricity.
Table 7. Selected materials for photovoltaic solar cells and panels
| Solar Energy Materials | US Supply | Major Import Sources |
| Glass | Large sand production and reserves for making glass | Net exporter in 2008 |
| Aluminum | US supply | Net exporter in 2008 |
| Copper | US supply (32% import reliant) | Chile and Canada |
| indium | Negligible US supply from secondary sources | China, Japan, and Canada |
| gallium | Negligible US supply as by product of bauxite production | China, Ukraine and Germany |
| Tellurium | Byproduct of zinc production | Belgium, Canada, and China |
| S | Byproduct of copper production | Belgium and Canada |
| cadmium | Byproduct of copper production | Net exporter in 2008 |
| Silicon Metal | Some US production (less than 50% import reliant) | Brazil, South Africa, and Canada |
Source: US DOE, Solar America Initiative; "Emissions from photovoltaic cycles", Environmental Science and Technology, V. 2, No. 6, 2008.
Notes: Critical minerals that could be used in the manufacture of solar cells and panels include aluminum, indium, gallium, and tellurium: these are printed in bold.
Selected supply chain analyzes
In a supply chain analysis, it is equally important to know where new downstream capacities (processing, refining and metal alloying) are being built or expected to be built in the world, such as the likely investors in upstream critical mineral production capacities.
If you look at the complete delivery picture, it would be easier to determine where the potential risks are and what reduction measures are possible. In the following, two exemplary supply chains are described: rare earths and tantalum.
Rare earth elements
REE supply
Rare earths often appear with other elements such as copper, gold, uranium, phosphates and iron and are often a by-product. The lighter elements, such as lanthanum, cerium, praseodymium and neodymium, are more abundant and concentrated and usually make up around 80% -99% of a total deposit. The heavier elements - gadolinium through lutetium and yttrium - are more scarce, but very "sought after", according to the USGS raw material analysts.
Most REEs around the world are found in minerals bastnaesite and monazite mines. Bastnaesite deposits in the United States and China represent the largest concentrations of REEs, while monazite deposits in Australia, South Africa, China, Brazil, Malaysia and India represent the second largest concentrations of REEs. Bastnaesite occurs as a primary mineral, while monazite occurs in primary ores of other ores and is typically recovered as a by-product. Over 90% of the world's economically viable rare earth elements are in primary mineral deposits (eg, bastnaesite).
REE supply chain
The rare earth supply chain generally consists of mining, separation, refining, alloying and manufacturing (equipment and components). A major problem for REE development in the United States is the lack of refining, alloying and manufacturing capabilities that could process rare earth production.
An April GAO report 2010 illustrates the US's lack of presence in the REE global supply chain in each of the five stages of mining, separation, refining oxides to metals, producing alloys, and manufacturing magnets and other components. According to GAO 2010 report, China produced about 95% of the REE raw materials and about 97% of the rare earth oxides and was the only exporter of commercial rare earth metal (Japan produced some metals for its own use in alloys and magnet production). About 90% of the metal alloys were made in China, and China manufactures 75% of the NdFeB magnets and 60% of the samarium cobalt magnets (SmCo). Even if US rare earth production increases without significant investment in the supply chain, much of the processing and metal processing would likely take place in China.
In the case of rare earths, it is not enough to develop REE mining outside of China alone, without building up the value, metal production and alloying capabilities that would be required to manufacture individual parts for final products. According to rare earth analyst Jack Lifton, vertically integrated companies may be more desirable. It might be the best way to secure investor financing for REE production projects. Joint ventures, consortia and cooperatives could be established to support production at different stages of the supply chain in optimal locations around the world. Each investor or producer could have equity and purchase commitments. Where US companies and US allies invest, they can help achieve the goal of a secure and stable supply of electrical and electronic equipment, intermediates, and components needed to assemble end-products.
In 2019, ThREE Consulting's rare earth analyst James Kennedy writes that China’s dominance and “absolute advantage” in the rare earth field is reflected in its national laboratories and the Baotou Research Institute of rare earths in basic research, materials science and rare earths. Fundamentally reflects metallurgy. ThREE Consulting has shown that China has filed more rare earth patents than the rest of the world combined, and Kennedy states that patents acquired in the rare earth space are likely to be a proxy for next generation technology.
China's state-of-the-art approach to rare earths and other critical minerals could hold China in its dominant position for the foreseeable future.
Tantalum
Tantalum is a metallic element found in mineral tantalite derived from primary and placer mineral deposits. It is often found in niobium, but is also present in other minerals such as rare earth, uranium and cassiterite (tin ore). Tantalum was produced as a primary, by-product and by-product of other ores. The high melting point (3.000 degrees Celsius) and the corrosion resistance of tantalum make it super-capacitive (ie characterized by a high capacity for storing and releasing electrical charges). This metal, which is used in many high-tech electronic devices, is produced and traded in conflict areas in Central Africa; Therefore, Tantalum is classified in certain cases as a conflict mineral and is subject to the disclosure requirements of the Dodd-Frank Wall Street Reform and Consumer Protection Act (PL 111-203, 15 USC §78) .100 Section 1502 of the Act contains the impression that conflict minerals in the Democratic Republic of Congo or neighboring countries to finance extreme violent acts in the DRC.
tantalum supply
There are four major sources of supplies for the tantalum market: primary production (industrial and artisanal), tin-slag processing, scrap processing and recycling and by-product production (also referred to as secondary concentrate). Primary production accounts for about 70% of global supply. Tantalum from tin slag (waste) has historically been produced mainly in Malaysia, Thailand and Brazil. Tantalum is also a by-product of niobium, titanium, tin and uranium, which is produced in Malaysia, Brazil, China and Russia.
Recycled tantalum makes up 30% of the global supply, mainly from “pre-consumer scrap” in the production facility. The United States and Mexico account for 61% of tantalum scrap production, and it is estimated that scrap could provide 50% of the world's tantalum supply by 2025.
Based on USGS data, Brazil, Canada, Mozambique, and Nigeria were countries that led the way in primary tantalum production in the 1970s. Brazil and Canada continued to be the main producing countries in the 1980s. Australia took first place in the late 1980s and 1990s, followed by Brazil through 2009, after which the USGS did not report primary production for Australia. The Australian mines closed after the 2008 recession, reopened in 2012 and closed again shortly after in 2012. Since around 2009 it has been stated by several sources that the Democratic Republic of the Congo is a leading producer country with tens of thousands of artisanal miners (see Table 4). The tantalum production recorded by the USGS shows a shift in production - at least what has been reported since 2000 - from Australia and Brazil to the Democratic Republic of the Congo and Rwanda.
In recent decades, there have been significant gaps in the publicly available data for tantalum; The reported production data was significantly lower than the processor records. In one example, the manufacturer's average supply to the total processor's revenue gap, measured over six quarters, was 73%. On average, the reported production accounts for about 27% of the total revenues of the processors during the reporting period. It resulted in an average material difference of 381 tons.
Part of the explanation for such reporting patterns could be the highly unregulated nature of tantalum production and trade in Central Africa. The high production in the unreported (informal) sector of the mining company led to falling prices and forced many of the large eligible regions to cease their operations. At low prices, investor interest is limited; Investors are therefore constrained by high risk Greenfield projects (ie new projects or work that does not follow up on previous work).
The USGS data does not reflect the level of production from unauthorized (often illegal) mining activities - usually artisanal mining activities. The USGS collects its data from a variety of sources, but regards the tantalum industry as “confidential” with incomplete access to data and little transparency. In general, there is insufficient data to make final determinations on actual production, capacity and reserve for tantalum on a global basis. There are several reasons for this difference in supply and demand, including the following:
Non-reporting or under-reporting of all forms of care (primary, by-product, pebble and scrap) through the Tantalum Niobium International Study Center (TIC) or elsewhere.
High stock levels. Several analysts have noted that since the recession in 2008 year, many companies have sold out of their aboveground stocks.
Illegal mining and trade. There are established networks for the smuggling of tantalum and other minerals from Central Africa (and other countries) into the market.
Dependence on African supply and this disruption could have consequences, eg price increases. Africa provides 80% of primary tantalum production (60% from the DRC and Rwanda) as China dominates downstream processing and production capacity. The illegal mine component on the tantalum market makes it vulnerable and potentially unsustainable, as it prevents the entry of large producers into the market. The illegal tantalum trade has long-term effects on the entire supply chain, resulting in lower investment at all stages of the supply chain.
In the year 2016, the USGS listed Australia and Brazil with 85% of the world's tantalum reserves, but the USGS regularly states that data is unavailable or simply unknown to other countries. The USGS lists Australia, Brazil and Canada as the majority of the world has identified tantalum resources.
The tantalum supply chain
In 2017, Mancheri, et al. Published a study that assessed the tantalum supply chain for regional production dependency, potential for supply disruptions, and mechanisms to avoid disruption using a "resilience" of the supply model. This method examines four resilience indicators: diversity of supply, material substitution, recycling and storage and is dependent on three factors: resistance, speed and flexibility. Mancheri's study concludes that the tantalum market is flexible and resilient based on how it deals with unreported and presumably illegal trade relationships and its impact on conventional large tantalum producers. Mancheri's study concluded that warehousing and substitution can mitigate some supply disruption.
In general, tantalum follows the following steps in the supply chain:
The primary ore is crushed and ground into an ore concentrate that is further processed into oxides (metal or powder) or K salt (which is reduced to tantalum metal) used to make capacitors, wires, superalloys, and other fabricated shapes. Downstream manufacturers use these materials for parts used by consumer goods manufacturers and others. China has 16 tantalum processing equipment; The United States has one, according to the Mancheri study. There are four processing plants in Germany and four in Japan.
The metal or powder form is then used by electronics manufacturers to manufacture capacitors and other products. The manufactured parts are supplied to consumer goods manufacturers such as Motorola, Sony, Apple, Dell and others. China dominates the production of capacitors.
Current political framework
US mineral policy
As stated in two important statutes, the current objective of US mineral policy is to promote adequate, stable and reliable supplies of materials for national security, economic prosperity and US industrial production. US mineral policy attaches importance to the development of domestic supplies of critical materials and encourages the domestic private sector to produce and process these materials. But some raw materials do not exist in economic quantities in the United States, and the processing, manufacturing and other downstream companies in the United States may not be cost effective with facilities in other regions of the world. However, public policy or executive action has been taken (eg, the percentage reduction charge for US mining activities and royalty-free production on publicly-available land) to offset the US disadvantage over its potentially more expensive activities. The private sector can also achieve cheaper operations with technological breakthroughs.
Based on this policy framework, Congress has held numerous legislative hearings on the impact of the high import dependency of the US economy on many critical materials and on a number of potential federal investments that would support the development of increased domestic production and the production of reliable suppliers. There is a long-term political interest in the dependence on mineral imports and their impact on national security and the US economy.
General Mining Law of 1872: mining in federal states
The mining of localizable minerals (also called hard rock minerals) on federal states is primarily regulated by the General Mining Law of 1872 (30 USC §§21-54). The original goals of the Mining Act were to encourage mineral exploration and development in states in the western United States, the ability to obtain clear ownership of mines already under construction, and settlement in the west. The Mining Act grants individuals and companies free access to search for minerals in publicly accessible areas and allows them to claim (or “locate”) the deposit upon discovery. A valid claim entitles the holder to develop the minerals. The mining law of 1872 originally applied to all valuable mineral deposits with the exception of coal (17 Stat. 91, 1872, as amended).
Not-for-profit real estate is those that have been federally owned since their original purchase by contract, assignment, or purchase as part of the general territory of the United States, including real estate that has disappeared from federal ownership but has been returned to federal ownership. "Acquired" property acquired by purchase, donation, or condemnation by any state or private owner for certain federal purposes rather than the general area of the United States is subject to rental only and is not covered by the 1872 Act. Acquired land is regulated by the Mineral Leasing for Acquired Lands Act of 1947.
Under the General Mining Act, mineral claims can be held indefinitely without mineral production. Once land was granted to transfer the full ownership of the plaintiff, the owner could use the plots for a variety of purposes, including non-mineral ones. However, the use of land under an undeclared mining claim for anything other than mineral and related purposes is contrary to the General Mining Act. Critics believe that many claims are made for speculative purposes. However, industry commentators argue that a claim can go unused until market conditions make it profitable to open up the deposit. Since 1994, the Congress has issued a moratorium on the patenting of land under annual licensing laws.
Most of the mineral production in the United States is privately owned and regulated by states that can use a lease and approval framework. The regulatory framework described below applies primarily to minerals produced on state territory but has implications for the entire US mining industry.
It is being discussed whether rationalizing the licensing process to federal states would make mining investment in the United States more attractive or encourage investors. Proponents of streamlining the framework believe that mining companies would be more likely to invest in the United States, given faster completion of the mine clearance process. However, mining companies have decision-making processes with multiple factors; they go to where the minerals are located, and they are often looking for low political and country risk (good governance) and a feeling of certainty about the regulatory environment and low cost production opportunities.
In recent decades, a debate has arisen over whether the federal government should levy a royalty on the value of minerals produced on public land, as well as on other land in the United States (ie state and private land) and other parts the world is common. Further discussion of this debate goes beyond the scope of this report.
Federal Land Management and Mineral Development: Regulatory framework for mineral development in federal states
The mineralization activities in the United States are subject to a number of regulatory requirements. The specific laws and regulations that apply and how compliance is achieved will vary depending on the specific mineral development project (eg, specific measures to comply with federal law may be required if the mining project can be federally protected). That is, for federal state mining, there are several federal regulations that may apply in addition to the Federal Mining Act of 1872. These requirements include, but are not limited to, environmental assessments, sufficient financial evidence, permits, surface management requirements, liability and public participation. The appendix contains a list of the selected laws and regulations for mineral development on federal state. A discussion on the regulatory compliance process and the various companies involved at federal, state and other levels goes beyond the scope of this report. The following discussion focuses on the legal framework for the management of and access to minerals for development on state.
In the 1960er and 1970 years, the Multiple Use Sustained Yield Act (16 USC §§528-531), the Wilderness Act of 1964 (16 USC §§1131-1136), the National Forest Management Act of 1976 (43 USC §§ 1701 et seq.), The National Environmental Policy Act of 1969 (NEPA, 42 USC §§4321 et seq.) And the Federal Land Policy Management Act (FLPMA) (43 USC §1701 et seq.), Which deal with environmental protection, the Multiple use and the management of federal land in general. By laying down requirements for the activities of the authorities, these laws have influenced mineral development under both the leasing system and the General Mining Law of 1872, the claim system. The General Mining Act does not contain direct environmental controls, but mining claims are subject to all general environmental laws as a prerequisite for development.
The Bureau of Land Management (BLM) manages the mineral program on all federal land, but other land management agencies, such as the Forest Service (FS), must approve surface disruptive activities on their property. BLM and FS use the mine plan review process (which includes mining and remediation plans) to determine the validity of the mine proposal and determine how extensive an environmental review under the Federal Land Policy and Management Act of 1976 is required.
Federal law on the management of land policy
1976's Federal Land Policy and Management Act requires resource management plans (RMPs) for areas or areas of public space prior to development. BLM must consider the environmental impact of land use planning when developing and implementing RMPs. RMPs can cover large areas, often hundreds of thousands of acres in multiple districts. Through the planning process, the BLM determines which areas are open to mining claims and possible development.
Regarding the land use plans, FLPMA says: “The secretary [of the interior] develops, maintains and revises with public participation and in accordance with the terms of this law land use plans which areas or areas are designated for the use of public space. The applicable planning regulations require the creation of an environmental assessment document for the land use plans in accordance with the National Environmental Policy Act.
FLPMA requires that RMPs reflect different uses - such as wood, pasture, wildlife, recreation and energy - and consider the needs of present and future generations. The effects of various uses are recognized at an early stage so that they can be weighed against each other on an equal footing by the BLM. The plans are also intended to weigh the various advantages of public space.
Withdrawals from the mineral entry and access to the state
The President and Executive Agencies have in the past issued executive orders, secretarial mandates and public land ordinances to release federal states from mineral extraction and other uses under the authority of the president, including certain statutory powers such as the Antiquities Act (34 Stat 225). Since 1976 the departure of executives is regulated by the FLPMA. FLPMA reversed former landfall sites. Withdrawals from packages exceeding 5.000 hectares require the approval of the Congress.
A withdrawal under FLPMA restricts the use of land in the context of multi-management and typically divides the property for some 20 years from some or all of the public land laws as well as some or all of the mining and mineral leases laws. First, the area will be separated for a two-year period with an environmental review to determine whether a longer-term withdrawal of 20 years is warranted. The longer-term withdrawal is often subject to renewal by the Interior Ministry.
The redemption may be temporary or permanent. Under this section of the Code, the Home Secretary may make, modify, extend or revoke disbursements.
As a rule, land levies of the federal state are subject to valid existing rights, so that the mineral rights holder can develop these minerals according to the conditions of the federal state authority (eg national park authority, BLM or forestry office).
Mineral industry officials claim that state retreats hinder mineral exploration and limit reserves, even when production conditions are favorable. So they explain that without new reserves or technological advances, the cost of mineral production can increase. They further argue that higher domestic costs could lead to more exploration on foreign soil, which could potentially increase US import dependency.
Critics of US mineral development claim that mining is often an exclusive land use, as it can exclude other uses, and that in many cases there is no way to protect other land values and uses that are nearing the withdrawal of land from development stand by the General Mining Law. They refer to unrecovered areas associated with previous hard rock developments, Superfund sites associated with past mining and smelting, and cases where the exploitation of mineral resources adversely affects or destroys natural, historical, cultural and other resources on public lands could.
For decades, Congress has been debating how much land should be available for the extractive industries or other uses, and how much should be provided for conservation or environmental purposes (eg, outside or restricted).
Selected Critical Minerals-related Laws in 115. and 116. congress
116. congress
HR 2531, National Strategic and Critical Minerals Production Act, Introduced by Rep. Mark E. Amodei on May 7, 2019, and referred to the House Committee on Natural Resources. The bill would define critical and strategic minerals and aims to streamline the nationwide approval process for domestic mineral exploration and development. It would establish the responsibilities of the federal "leading" agency to set targets for mine approval, minimize delays, and meet timelines in assessing a mine operation plan. The review process would be limited to 30 months and the bill would prioritize the Lead Agency to maximize mineral resource development while mitigating its environmental impact.
HR 2500, National Defense Authorization Act (NDAA) for the year 2020, reported in the house. The bill would require the Secretary of Defense to provide guidance on acquiring rare earth items and guidance on building a secure supply chain for rare earth materials within the United States. The bill provides for the Secretary to acquire rare cerium and lanthanum compounds and electrolytic manganese metal. And further, for DOD purposes, the law would prohibit the acquisition of tantalum from non-allied foreign nations.
The reported Senate version (p. 1790) of the WJ2020 NDAA does not contain a similar language.
S. 1317, American Mineral Security Act, introduced by Senator Murkowski at 2. May 2019, and referred to the Senate Committee on Energy and Natural Resources.
The bill would define what critical minerals are but also require the Home Secretary to introduce a methodology that determines which minerals are considered critical. The Home Secretary would be required to keep a list of critical minerals. The bill would provide an analytical and predictive capacity for the dynamics of the mineral / metals market within US mineral policy. The Home Secretary would be required to undertake a comprehensive resource assessment of the potential of critical mineral resources in the United States, first assessing the most critical minerals.
The bill would require that an agency review and report be designed to facilitate a more efficient process of critical mineral exploration in federal states, and in particular require performance metrics for the approval of mineralization measures and a timetable of each phase of the process.
The bill would require the Department of Energy to set up an R&D program to study alternatives to critical minerals and examine recycling and material efficiencies across the supply chain. The Home Office would be required to produce an annual report on critical minerals that would forecast domestic supply, demand and price for up to 10 years.
The Minister of Labor, in consultation with the National Science Foundation and other relevant institutions, should assess the availability of domestic technically trained personnel to explore the production, manufacture, reuse, prediction, and analysis of United States critical minerals. It should be noted, among other things, that there is currently a shortage of skilled workers and that there is likely to be a shortage of skilled labor in the future. The secretary would need to design an interdisciplinary curriculum study on critical minerals and set up a competitive scholarship program for new faculty positions, internships, equipment needs and research on critical minerals. 2020-2029 would be entitled to 50 $ 1 million per year to enforce this law.
115. congress
520, National Strategic and Critical Minerals Production Act, introduced by Mark E. Amodei at 13. January 2017, and referred to House Committee on Natural Resources. This bill is similar to the draft law 2531 (in the 116 Congress) described above.
1407, METALS Act, introduced by Representative Duncan Hunter at 7. March 2017, and referred to the House Committee on Armed Services.
This Bill would have set up a Strategic Materials Investment Fund, allowing the Secretary of Defense to provide loans for domestic production and processing of strategic and critical materials, and supporting the development of new technologies for more efficient processing of strategic and critical materials.
For the 2018 to 2023 financial years, 1/10 of 1% of the amounts estimated for "covered programs" would have been paid into the fund. Programs covered would be any major defense procurement program for the development or procurement of aircraft or missiles. The bill would have banned the sale of domestic rare earth mines to foreign companies.
HR 5515 (PL 115-232), John S. McCain's National Defense Approval Act for the 2019 financial year, included a provision instructing the Secretary of Defense to source rare earth permanent magnets and certain tungsten, tantalum and molybdenum sources outside of China, Russia, North Korea and Iran, as far as possible.
1460, 2017 Energy and Natural Resources Act, Subtitle D - Critical Minerals, introduced by Senator Murkowski on June 18, 2017 and referred to the Senate Committee on Energy and Natural Resources. This bill is similar to p. 1317 (in the 116th Congress).
S. 145, National Law for the Production of Strategic and Critical Minerals (similar to HR 520 in 115 Congress), introduced by Senator Heller on 12. January 2017, and referred to the Senate Committee on Energy and Natural Resources.
Earlier congresses
Similar laws for critical minerals have been introduced in previous congresses. On the 113. For example, there was a congress 1600, the Critical Minerals Policy Act of 2013, and HR 761, the National Strategic and Critical Minerals Production Act of 2013, that at the 18. September 2013 passed the house. The 113. Congress, HR 4883, the National Rare Earth Cooperative Act of 2014, proposed to advance the domestic refining of heavy rare earth oxides and the safe storage of thorium for future use through a cooperative ownership approach. Thorium is associated with certain rare earth occurrences and waste materials. The cooperative would have acted according to a federal constitution consisting of suppliers and consumers as owners.
Additional policy options
This section contains a discussion of selected policy options related to critical minerals that are in the legislation of the 115. and 116. Congress were recorded. In addition to weighing the pros and cons of the various policy options discussed above and below, policy makers have the opportunity to maintain the status quo of current policies.
Management of mineral information
The USGS could set up information management for minerals providing information and analysis on the global picture of supply and demand of minerals and metals. Companies producing minerals on public land could be asked to report production data to the federal agency.
Greater exploration for critical minerals
Promoting greater exploration of critical minerals in the US, Australia, Africa and Canada could be part of a comprehensive international strategy. There are few companies in the world that can provide exploration and development capabilities and technologies for the development of critical minerals. These few companies are located primarily in the four regions mentioned above and in China and may form joint ventures or other types of research and development alliances, as well as exploration and development of critical mineral deposits worldwide, including those in the United States. Whether these collaborative efforts in the US should be limited is a matter of congressional thinking.
Other policy options
Other measures of the Congress could include the monitoring of free trade issues related to the supply of critical minerals. The World Trade Organization (WTO) has taken up two commodity issues related to export restrictions for China. An 2011 case was filed by the US against China, including restrictions on bauxite, magnesium, manganese, silicon metal and zinc (using export quotas and export taxes). The other case, which was settled with 2012, was filed by the US, Japan and the European Union for export restrictions on rare earth oxides, tungsten and molybdenum. In both cases, the WTO ruled against China and concluded that China failed to explain the link between resource conservation or environmental protection (and public health protection) and the need for export restrictions.
The United States could support more trade missions; Supporting US trade delegations to China and other mineral producing countries; Helping smaller and less developed countries to improve their governance capacity. Although there are concerns that trade tariffs with China could affect the prices and availability of critical minerals and downstream metals imported from China, the impact will depend on the specifics of the tariffs and their respective minerals and metals.
Further Considerations
In China and other emerging economies, economic development will continue to have a major impact on the global supply and availability of raw materials and downstream products. Different countries may need to make adjustments to secure the required raw materials, metals and finished goods for national security and economic development. China, Japan and others are already actively involved in reliable mineral supply. Many companies have moved to China to gain access to their market, to raw materials or intermediates, and to generally more cost-effective mineral production. At the same time, China is seeking technology transfer from many of these companies to expand its downstream manufacturing capabilities. In spite of China's current overcapacity and increased exports of some raw materials, it may be in the long term China's interest to use its minerals (plus imports) for the domestic production of higher value downstream products (eg components and consumer electronics). Higher costs, inefficient plants and mines can be closed, which results in China aiming for more imports when consolidating mining.
The impact on China's dominance in supply and demand of global commodities could be partially addressed by the consistent development of alternative sources of supply, the use of alternative materials, efficiency gains, aggressive R & D in the development of new technologies and comprehensive mineral information to support these efforts. China is likely entering an era of less commodity exports, which may result in long-term private sector plans and government agencies seeking to meet US national security, economic and energy interests and challenges. Some stakeholders may wish to dispel concerns about the WTO.
Other questions that Congress might think about are: How long would it take to develop US manufacturing capabilities? Would an international educational exchange program be appropriate with countries already involved in the refining and recycling of critical minerals?
Further analysis would be useful to examine the ability of US firms to cope with delivery bottlenecks such as export restrictions in other countries, underinvestment in capacity, material use in other countries and at home, one-stop problems, strikes, power outages, natural disasters, and political issues Risk and lack of replacement. Such analysis and understanding can influence public policy. Further information may be under consideration as Congress and other policymakers evaluate available policy options and their effectiveness to minimize the risk of disrupting the supply of critical and strategic minerals and metals.
ISE / Arndt Uhlendorff - October 2019